


Gravity was once a mystery. But now we understand that this is the force that keeps everything from floating off into space. Gravity is the force that pulls us back to earth after we jump as high as we can.
Traders sometimes forget that a similar principle applies to the stock market. When prices rise sharply, they expect the trend to continue. The same is true when prices fall sharply.
However, there is a tendency for price changes in major indexes to revert to the mean. So, after large swings upward like we saw when a COVID-19 vaccine breakthrough was announced, we tend to see a reversal back to the long-term average.
One way to determine when stock prices move too far in one direction is with breadth indicators. These indicators give each stock equal weighting.
Below is a chart showing the percentage of stocks in the S&P 500 that are in long-term uptrends. It’s at an extreme level rarely seen in the past, with 80% of the stocks in long-term uptrends.
Almost All Stocks Are Rising

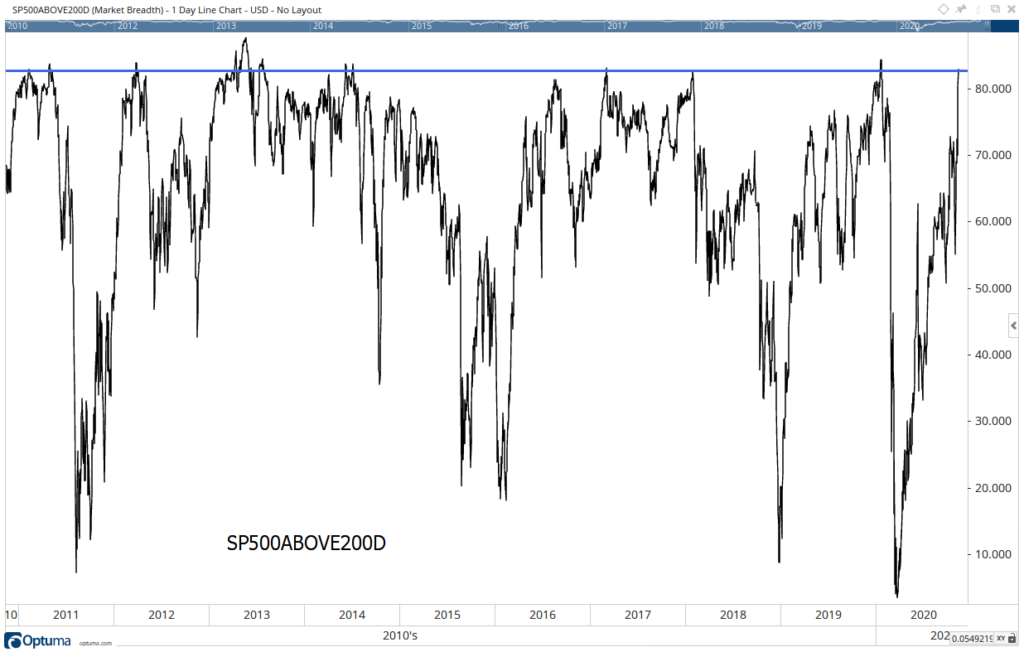
Source: Optuma.
The S&P 500 includes stocks from every sector in the economy. It’s unlikely that each sector should be moving in the same direction at one time.
For example, if video game sales are strong, we would expect sporting goods stocks to be doing poorly because consumers have limited disposable income. Many are buying one or the other.
When almost all stocks are moving in the same direction, as they are now, it is a sign that traders are irrationally exuberant. These periods of extreme bullishness rarely last long, and the stock market almost always reverses after extremes are reached.
With 80% of the stocks in the S&P 500 in long-term uptrends, it is time to prepare for a reversal. In the past, these reversals came quickly when breadth was this high.
Michael Carr is a Chartered Market Technician for Banyan Hill Publishing and the Editor of One Trade, Peak Velocity Trader and Precision Profits. He teaches technical analysis and quantitative technical analysis at the New York Institute of Finance. Mr. Carr is also the former editor of the CMT Association newsletter, Technically Speaking.
Follow him on Twitter @MichaelCarrGuru.