



Walk into any supermarket, and you’re standing inside one of the toughest businesses on Earth.
The average grocery store keeps about a penny and a half of profit for every dollar that passes through the register.
That’s it. Fill a cart with $200 worth of groceries, and after paying for inventory, labor, rent, and everything else, the store pockets maybe $3.
That’s the business model: move mountains of product, keep almost none of the money and pray the volume carries you.
For most of American history, that penny-pinching world was the rule, not the exception. Keep a nickel on the dollar, and you have a good business. A dime made you a great one.
So, what I’m about to show you would have looked like pure fantasy a generation ago.
Right now, the average S&P 500 Index company keeps nearly $0.16 of profit out of every sales dollar.
Fifteen-point-seven cents, to be exact.
That’s a record. We have never, in the history of this index, kept this much of what we sell.
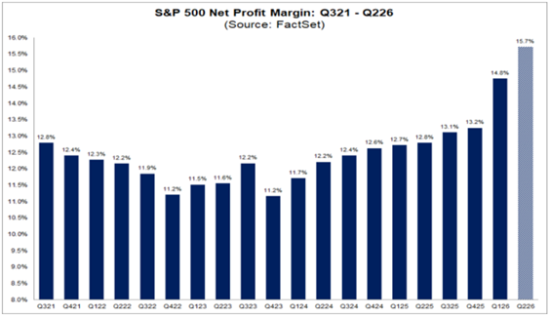

The trend almost looks like a mistake.
Margins crawled along in the 11-to-13-cent range for years. They dipped to $0.11 back in late 2022, when everyone was sure a recession would gut Corporate America.
Then something broke loose.
The last two bars shoot straight up — more than $0.14 last quarter, and an estimated $0.16 cents for the current quarter.
That is not a slow grind higher. That is a company learning to print money.
So where is it coming from? This is the part that matters, because “the market” isn’t one thing. When you crack the broader market open by sector, the record isn’t spread evenly at all.
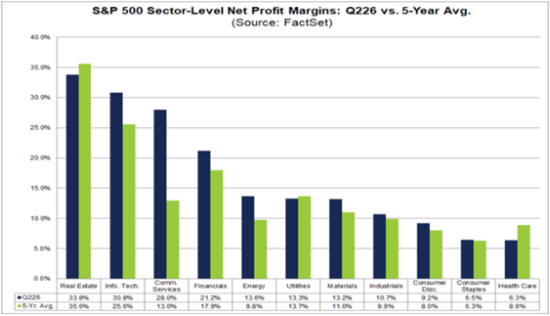
Two groups are doing the heavy lifting. Technology now trades at almost $0.31 on the dollar, well above its five-year average.
And Communication Services — like ad and streaming giants — keep a staggering $0.28, roughly double what that group used to earn. Those two sectors aren’t riding the wave. They are the wave.
Then there’s the other end of the boat. Health Care remains just over $0.06 on the dollar today, which is actually below its five-year norm. Real Estate slipped under its average, too. So while the headline screams “record profits,” a big slice of the market is quietly earning less than it used to.
That’s the whole game, isn’t it? The index tells you one story. The pieces underneath tell you the truth.
And that brings me to next week.
“Bullish” Earnings to Watch
These stocks are expected to beat their earnings per share (EPS) from the previous quarter. And if those expectations are met or exceeded, they could potentially trade higher.
For this screen, stocks must meet four criteria:
- 10 or more analysts cover the stock.
- The average analyst recommendation is a “Buy.”
- It BEAT analysts’ EPS estimates for the previous quarter.
- The average analyst estimate for the current quarter’s EPS is greater than the previous one.
Here are 10 companies that made this week’s list:
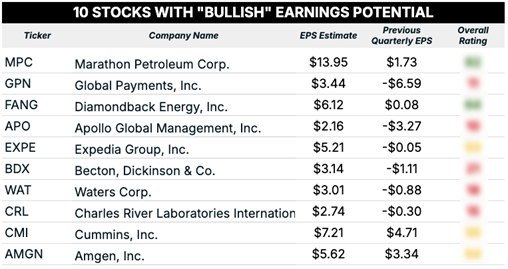

Start with the good side. On paper, 10 names are lined up to post dramatically better numbers than they did just a quarter ago.
Some of these swings are jaw-dropping. Global Payments is expected to flip from a $6.59 loss to a $3.44 profit. Apollo Global (APO), Expedia Group (EXPE), Waters Corp. (WAT), and Charles River Laboratories (CRL) — all of them are penciled in to go from red ink to black.
Here’s the catch, and it’s the reason I trust a rating over a headline. A big earnings jump looks bullish. It isn’t always. Of those 10 “improving” companies, Adam’s system lights up green — genuinely bullish — on only a couple.
On several of the rest, it’s actually flashing bearish, earnings rebound or not. The market has a way of pricing good news in long before the press release hits.
So let me hand you the one I’d circle.
A quarter ago, Marathon Petroleum (MPC) squeaked out $1.73 a share. Next week, the estimate is $13.95.
That’s not a typo — the refiner is expected to earn roughly 80 times what it made last quarter. And unlike most of the crowd on this list, the system reads Marathon as bullish across the board, not just for one hot quarter.
When the fundamentals, trend and momentum all point in the same direction, I pay attention. Energy, you’ll remember, is one of the sectors now earning well above its five-year margin. Marathon is drinking from that well.
If you want a second name to watch, keep an eye on Diamondback Energy (FANG) — from $0.08 a share to an estimated $6.12, and the system likes it too. Same sector, same tailwind.
“Bearish” Earnings to Watch
For our “bearish” earnings screen, we’re only looking for two things:
- 10 or more analysts must cover the stock.
- The average analyst estimate for the current quarter’s EPS is less than the previous quarter’s.
We want companies that are covered by a sufficiently large group of Wall Street analysts who collectively expect the company to report a quarter-over-quarter decline in earnings.
Here are 10 companies that passed this screen:
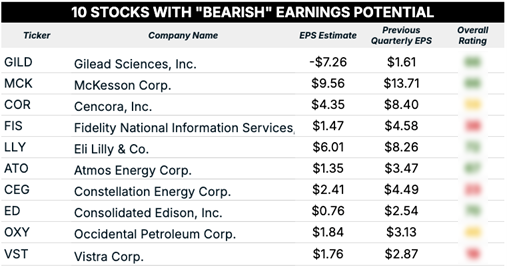

Now, flip the card over.
The other list is 10 companies my system flags as vulnerable heading into their reports. And just like the bullish board, the raw numbers can fool you.
Several of these names are expected to earn less than last quarter — yet the system stays constructive on them, because one soft quarter doesn’t break a good business. Eli Lilly (LLY) is projected to earn less than last quarter, and I’m not the least bit worried about Lilly. Consolidated Edison (ED), too.
A dip is not a downtrend.
The ones I am watching sit in a corner of the market that ties right back to where we started: the power complex.
Constellation Energy (CEG) and Vistra (VST) — two of the hottest stories in the whole electricity-and-data-center craze — are both expected to earn less next week than they did a quarter ago.
Constellation’s estimate slides from $4.49 to $2.41. Vistra slips, too. And here, the system doesn’t shrug it off the way it does with Lilly. It reads both as bearish going in.
That’s the part worth sitting with. Remember the sector chart? Utilities were among the few groups that earned below their five-year margins.
So when two of its glamour names walk into an earnings room with shrinking profits and a skeptical system, that’s not one warning sign. It’s two, pointing in the same direction.
I’ll give you one more to file away.
Gilead is staring at an ugly headline number next week — an estimated loss of more than $7 a share, thanks to a one-time charge. Looks like a disaster.
But Adam’s system still reads Gilead as more bull than bear, which is exactly the lesson of this whole issue: don’t let a single scary print tell you what a company is worth.
Here’s the one thing to take away from today’s issue. Record margins are real, but they are not evenly shared. A rising tide is lifting Tech, Energy and Communications, while leaving Health Care and parts of the utility world behind.
So next week, don’t trade the headlines. When Marathon and Diamondback report, you’ll already know the system had them marked bullish before the numbers hit. When the power names stumble, you’ll know that wasn’t a surprise either.
The earnings give you what happened. The system tells you what it means — and more importantly, what’s next.
Until next time…
Safe trading,

Matt Clark, CMSA®
Chief Research Analyst, What My System Says Today
