



Every week, Wall Street analysts go back to their spreadsheets and change their minds.
They bump a number here. They trim one there. Most investors never see it happen. But those small moves add up.
They tell you which way earnings are heading before the company reports.
So this week, I asked a simple question.
When analysts change their estimates, do they agree with Adam’s Green Zone Power Ratings system?
The answer is yes. And it’s not even close.
The Staircase You Can See
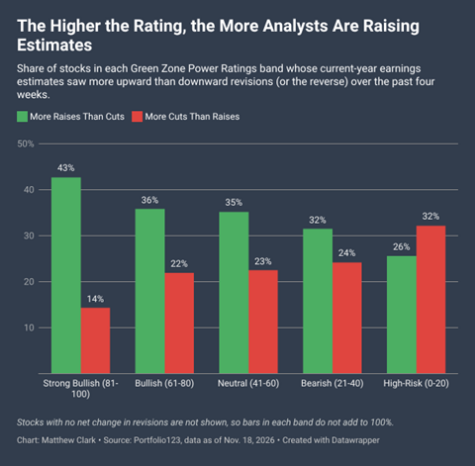

Here’s how I built it.
I split every stock into the five bands of Adam’s system. Strong Bullish at the top. High-Risk at the bottom. Then I looked at every estimate change for this year over the past four weeks.
For each stock, I asked one question: Did analysts raise their estimate more often than they cut it, or the other way around? Start with the green bars.
Among Strong Bullish stocks, 42.7% saw more raises than cuts. That falls to 35.8% for Bullish stocks. Then 35.2% for Neutral. Then 31.5% for Bearish. And just 25.6% for High-Risk.
Every step down the ratings, fewer stocks get raised.
The red bars run the other way. Only 14.3% of Strong Bullish stocks saw more cuts than raises. That climbs to 21.9%, then 22.5%, then 24.2%. At the High-Risk end, it hits 32.2%.
At the top, raises beat cuts 3-to-1. At the bottom, cuts win outright. High-Risk is the only band where that happens.
Why This Matters Now
Estimates are the bar a company has to clear on earnings day.
When analysts keep raising that bar, it usually means the business is doing better than they thought. Customers are buying. Margins are holding. The company is telling them good news.
When they keep cutting it, the opposite is true.
The ratings and the analysts point the same way, at both ends. That gives me more confidence in what the system flags as we head into next week’s reports.
It’s important to note that Thanksgiving week is usually slow. Not this time.
Adam’s system flagged nine stocks with “Bullish” earnings potential and 10 with “Bearish” potential. Most report before the turkey.
I’ll walk through one from each list.
“Bullish” Earnings to Watch
These stocks are expected to beat their earnings per share (EPS) from the previous quarter. And if those expectations are met or exceeded, they could potentially trade higher.
For this screen, stocks must meet four criteria:
- 10 or more analysts cover the stock.
- The average analyst recommendation is a “Buy.”
- It BEAT analysts’ EPS estimates for the previous quarter.
- The average analyst estimate for the current quarter’s EPS is greater than the previous one.
Here are the 9 companies that made this week’s list:
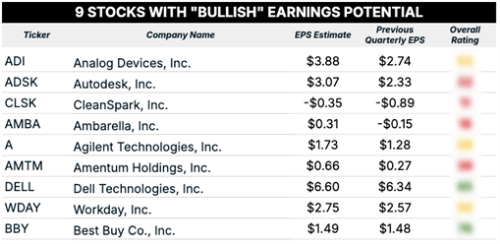

Dell Technologies Inc. (DELL) reports Tuesday, November 24, after the close. The estimate is $6.60 a share, up from $6.34 last quarter.
First, a note on that $6.34. That’s Dell’s GAAP number. On an adjusted basis, Dell earned $7.04 last quarter. So Wall Street actually expects Dell to earn a bit less than it did three months ago.
That’s a low bar for this company.
Look at how Dell handled the last one. Analysts expected about $4.91 a share. Dell delivered $7.04. That’s a 43% beat. Sales jumped 58% to $47 billion.
Then it raised the bar on itself. Dell lifted its full-year sales forecast by $25 billion, to $192 billion. It guided this quarter to $49 billion in sales and $6.50 a share. The estimate sits just above that.
And the orders kept coming. Dell booked $60.9 billion in AI server orders in a single quarter. It ended the quarter with a $95 billion AI backlog. That’s orders already signed. Dell just has to build and ship them.
So why is the stock getting crushed?
Dell closed at $588.40 on September 17. It now trades around $312. That’s a 47% drop in two months. One analyst downgraded the stock in October. Then the whole AI trade fell apart in November. Dell lost 14.9% in a single day on November 5.
None of that came from Dell’s business. There’s been no earnings report since September.
Today, Dell trades for about 10 times expected earnings. That’s cheap for a company growing sales this fast.
Now the caveat. Dell has to turn that backlog into sales. Parts are tight, and memory costs are rising. Hewlett Packard Enterprise reports first. Its server margins will be an early read on Dell’s.
But here’s why Tuesday matters.
If Dell clears its own $6.50 guide and holds its full-year forecast, the stock’s 47% slide starts to look like a mistake.
“Bearish” Earnings to Watch
For our “bearish” earnings screen, we’re only looking for two things:
- 10 or more analysts must cover the stock.
- The average analyst estimate for the current quarter’s EPS is less than the previous quarter’s.
We want companies that are covered by a sufficiently large group of Wall Street analysts who collectively expect the company to report a quarter-over-quarter (QOQ) decline in earnings.
Here are 10 companies that passed this screen:
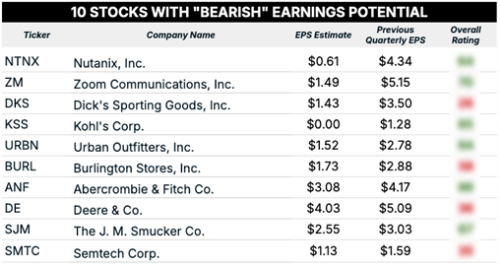

Deere & Co. (DE) reports Wednesday, November 25, before the open. The estimate is $4.03 per share, down from $5.09 per share last quarter.
Most of that drop is the calendar. Deere’s fourth quarter is always lighter. A year ago, it earned $3.93. So Wall Street wants about 3% growth.
Here’s the problem. Deere already told us what this quarter should look like.
In August, Deere guided full-year profit to $4.75 billion to $5 billion. It had already earned $3.8 billion through nine months. That leaves about $940 million to $1.19 billion for this quarter. At the midpoint, that works out to about $3.94 a share.
The estimate is $4.03. Analysts are already above the middle of Deere’s own range.
And some of the help is gone. Tariff refunds added $382 million to Deere’s results over the first nine months. Deere doesn’t expect more of them this quarter.
Meanwhile, the core farm business is still shrinking. Big tractor and combine sales fell 6% last quarter. Deere expects that business to drop about 10% for the full year.
The company expects U.S. and Canadian sales of large farm equipment to fall 15% to 20%. Demand in South America and Europe got softer, too.
What kept Deere’s numbers up? Construction.
That business grew 18% last quarter. Small tractors and mowers grew 12%. Those are good businesses. But they aren’t what made Deere famous.
Yet the stock trades around $646. That’s 28 times expected earnings. Investors are paying up for a turn in the farm cycle.
Deere did say its order book points to 2026 as the bottom. To be fair, it has beaten estimates in each of the last three quarters.
But remember last year. Deere beat its fourth-quarter estimate. Then it gave a weak outlook for the next year. The stock fell 5% before the open.
The quarter isn’t the real event. The 2027 forecast is.
What To Do Next Week
Here’s your plan.
If you own Deere, don’t add before Wednesday morning. Skip the headline number. Go straight to the 2027 profit forecast. If it doesn’t show real growth in the farm business, the stock got ahead of itself.
If you’re watching Dell, Tuesday night is your moment. Check sales against the $49 billion guide first. Then check whether Dell held its $192 billion full-year forecast. If both hold, the sell-off priced in a problem that didn’t happen.
And keep both tables handy. The rest of the names report all week long.
The ratings and the analysts agree. When they line up on a stock heading into earnings, pay attention.
Until next time…
Safe trading,

Matt Clark, CMSA®
Chief Research Analyst, What My System Says Today
