


In the 1990s, individual investors obsessed over a chart pattern.
The cup and handle (C&H) pattern was an important part of the CAN SLIM trading strategy. It’s also rated one of the most reliable patterns.
CAN SLIM, a system used to select growth stocks based on different analyses, was almost a trading cult. Individuals read Investors Business Daily, a newspaper that was designed around the strategy. They held meetings all around the country and they chased momentum stocks. For a time, the strategy worked well.
The C&H pattern can be traded on its own, without the other components of CAN SLIM.
Fidelity defines the pattern as:
A bullish continuation pattern that marks a consolidation period followed by a breakout.
The cup forms after an advance and looks like a bowl or rounding bottom. As the cup is completed, a trading range develops on the right-hand side, and the handle is formed.
A subsequent breakout from the handle’s trading range signals a continuation of the prior advance.
For an example of the pattern, we can look at the SPDR Gold Shares ETF (NYSE: GLD) chart below. The pattern is outlined with a green dashed line.
GLD’s Cup and Handle Pattern Since 2011

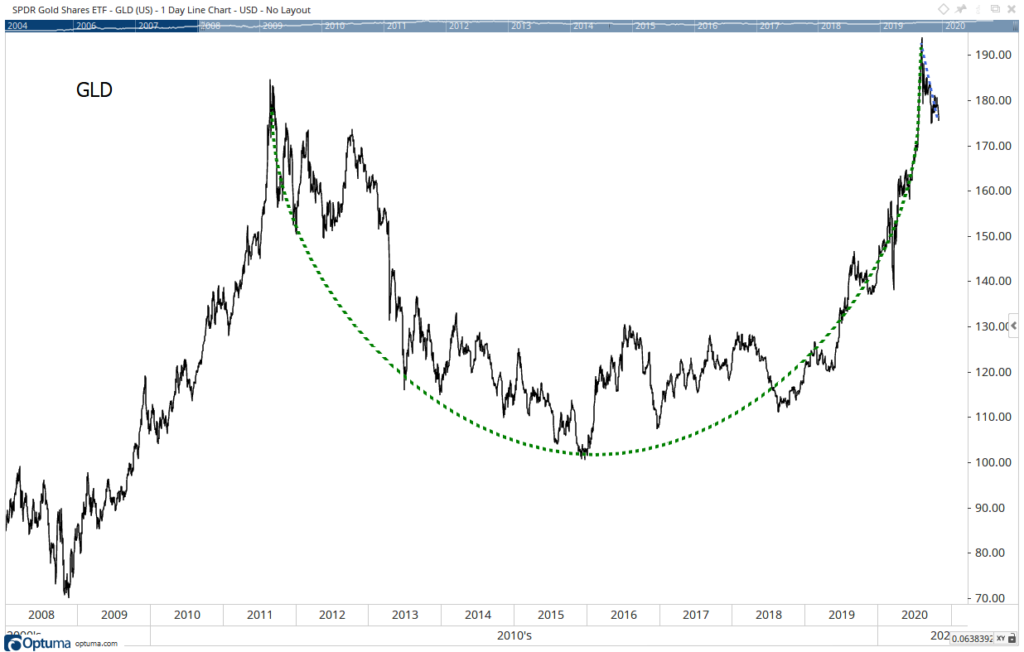
Source: Optuma.
What Gold’s Cup and Handle Pattern Means
In How to Make Money in Stocks, the book that introduced the C&H pattern, William O’Neil explained that the initial price target for a breakout is 20%.
That provides a price target of $228 for GLD or about $2,280 an ounce for gold.
But that is for a short-term pattern that sets up over six months. This is a long-term pattern that comes after a consolidation that formed over a decade. Momentum could carry the price of gold much higher.
Independent testing also shows that gold could trade much higher based on the C&H.
Prices move up an average of 54% after a breakout, according to the Encyclopedia of Chart Patterns.
Compared to other popular chart patterns, C&H patterns are ranked as the third-best pattern, meeting its profit target more than 60% of the time.
This pattern adds to the bullish case for gold and is just one more reason to consider adding precious metals to your portfolio.
Michael Carr is a Chartered Market Technician for Banyan Hill Publishing and the Editor of One Trade, Peak Velocity Trader and Precision Profits. He teaches technical analysis and quantitative technical analysis at the New York Institute of Finance. Mr. Carr is also the former editor of the CMT Association newsletter, Technically Speaking.
Follow him on Twitter @MichaelCarrGuru.