



Adam and I were talking earlier this week about a stock with a high Green Zone Power Rating.
I don’t even remember which one. What I remember is what he said…
A high rating and a good reason for it aren’t necessarily the same thing.
The Green Zone system tells you how a stock scores. It’s on you to ask why.
That idea stuck with me for a couple of days, and eventually it became a question I’d never actually put to the ratings before.
Here’s what I mean.
When a sector gets hot, almost everyone inside it starts looking like a genius. Margins improve across the board. Revenue accelerates for leaders and laggards alike. Prices rise for companies that did nothing except exist in the right industry at the right moment.
Adam’s six factors — momentum, size, volatility, value, quality and growth — should reward that. The numbers are the numbers, and the system evaluates every company the same way.
But a high-rated stock isn’t always a great business.
Sometimes it’s just the beneficiary of a great industry. That’s fine while the tide is rising. Once it goes out, you find out who was actually swimming.
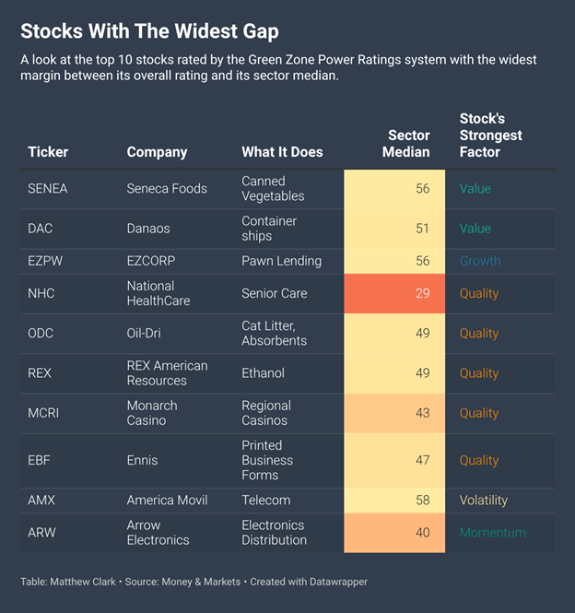
So instead of asking the usual question – which stocks have the highest Green Zone ratings? – I asked a different one: Which companies score far higher than the businesses sitting right beside them?
A sector tailwind can’t explain that. Every competitor enjoys the same backdrop. If one company is rated 40 points above its peers, the advantage must stem from something unique about the business itself.
I ran that screen this morning.
The first names that popped up weren’t AI darlings or data-center plays. They were a canned vegetable company, a cat litter manufacturer and a chain of pawn shops. In other words, exactly the kinds of companies Wall Street isn’t talking about.
The Quirk I Didn’t Expect
Building the screen meant checking something I’d never bothered to look at before: the median rating inside each sector. The score of the perfectly average company is in every corner of the market.
I assumed they’d all sit near 50. Ratings run 0 to 100, so the middle should be the middle.
Not even close.
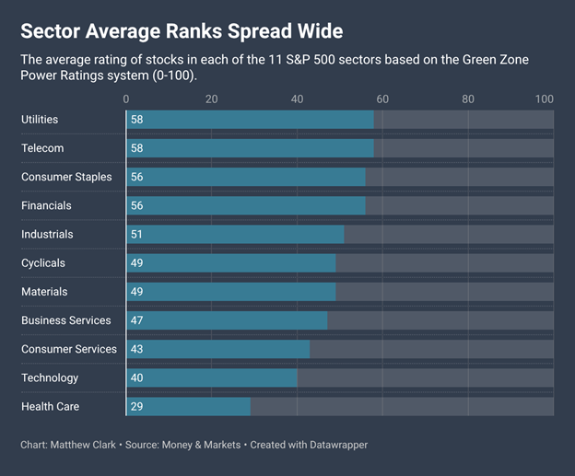

The range spans 29 points from bottom to top.
Both of those extremes describe an average company. But the average utility score is twice that of the average health care company.
That’s not a glitch.
It’s the ratings doing precisely what they’re built to do.
The system is saying that health care companies, as a group, are scoring poorly on Adam’s six measures.
Weak momentum. Punishing valuations on the growth names. Balance sheets that don’t compare well.
Utilities at 58 are saying the opposite. Steady, low volatility, sensible value, predictable.
The system isn’t confused.
It’s telling you where the market actually stands.
As I wrote in a June 24 issue, the market behaves like a nervous system, constantly sending signals about what’s changing beneath the surface. This is another one of those signals.
A Green Zone rating tells you what the market is rewarding.
Your job is figuring out why.
Where That Gets Practical
Now, look what the system does to a screen like mine.
I asked for stocks that beat their sector’s median by a wide margin. Sounds like one standard. It isn’t.
In health care, a company cleared my bar with a 54. That’s barely above average for the market as a whole.
In utilities, it needs an 83. Top-tier, no argument.
Same rule. Completely different achievement.
And if I’d simply sorted by the biggest gaps and published the top 10, I’d have handed you a list of health care stocks — not because health care is stuffed with exceptional companies, but because the bar in that sector is lying on the floor.
Which brings me to the most instructive comparison on today’s list.
National Health Care (NHC): The Biggest Gap, and Why I’m Not Leading With It
NHC runs skilled nursing and senior care facilities. Its rating clears the health care sector median by the widest margin of anything on my list.
It’s also a genuinely good company. Quality is its strongest factor, and Volatility is close… both are “Strong Bullish,” meaning they have been dramatically steadier than the typical health care stock.
It sits within 2% of its 52-week high, while much of its sector lies in ruins.
Revenue grew 11%, and the stock is up 19% in the past four weeks.
But I’m not going to simply take that margin at face value. Most of it is the sector median doing the work. Remember, the bar in health care is sitting at 29.
NHC didn’t have to be extraordinary to clear it — it had to be solid while its neighbors struggled.
Those are different accomplishments, and the size of the gap doesn’t distinguish between them.
This is exactly what Adam was getting at. The score is real. The reason for the score is a separate question, and you have to ask about it.
At 29 times earnings, it’s also the most expensive stock on today’s list.
Seneca Foods (SENEA): The Smaller Gap That Impresses Me More
Founded in 1949, SENEA is one of America’s leading providers of packaged fruits and vegetables.
Its margin over its own sector is narrower than NHC’s – arguably its most impressive feat considering that consumer staples is one of the highest-rated sectors in the market right now.
The typical food company scores 56, not 29. Seneca didn’t clear a low bar. It cleared a high one and kept going.
Then I opened up the six factors…
The weakest one, Size, still rated as “Bullish.”
Seneca’s worst factor still scores higher than the average food company’s overall rating.
That means there’s no soft spot to poke at for SENEA. With the company’s Value and Quality at “Strong Bullish,” it is simultaneously cheaper and better run than its competitors, at 10 times earnings.
Nobody is putting canned vegetables on a magazine cover. That’s exactly the point. Attention in this market follows sectors, not businesses.
Analysts cover hot industries. Financial media covers hot industries.
A company quietly outperforming its entire peer group in a cold one can go years without anyone saying so out loud.
Adam’s system isn’t impacted by headlines . It applies the same six factors to a vegetable canner as it does to a semiconductor company.
EZCORP (EZPW): The One I Had to Look Up Twice
EZPW is a pawn shop operator with roughly 1,300 shops across the U.S. and Latin America.
It clears the same high financial-sector bar Seneca faced — and it gets there from a completely different direction.
Growth is its strongest factor, with revenue up nearly 23%. Momentum and Quality both score “Strong Bullish”. Its weakest factor is Size at “Bullish”, and even that clears the sector median.
What interests me is why a pawn lender might be scoring like this.
It’s one of the few genuinely counter-cyclical businesses you can buy.
When household finances tighten, demand for small, collateralized loans rises, not falls. That’s an unusual shape for a financial company, and a long way from the community banks that make up most of this sector.
The system doesn’t know any of that.
It doesn’t know what a pawn shop is. It measured the usual six factors and flagged EZCORP.
The story is what I found when I went looking for the reason behind the score.

What I’d Watch
These are screen results, not recommendations. A screen tells you where to point the telescope. It doesn’t tell you what you’ll see once you look.
Check the sector median column before you get excited about anything here. That’s today’s whole lesson.
Clearing a bar set at 56 is a different achievement from clearing one set at 29 — and the ratings are honest about this, if you take the extra 30 seconds to consider the question Adam asked me.
One caution on the list. Danaos trades at 4.4 times earnings, and shipping companies almost always look cheap right before the cycle turns against them. In that industry, a low multiple is often as much a warning as a bargain.
The system narrowed 500 companies down to 10.
Until next time…
Safe trading,

Matt Clark, CMSA®
Chief Research Analyst, What My System Says Today
