


If there’s one word to characterize 2026’s market performance so far, that word would be “uncertainty.”
Year-to-date, the S&P 500 index is essentially flat. The vanguard of “Magnificent Seven” mega-cap tech stocks that once drove the market are now down 5% on the year.
And individual investors are clearly stuck wondering “what’s next?”
Will inflation start surging all over again? Will Trump’s policies engineer the calculated turnaround we’ve been waiting for? Will we see more tariffs?
It’s time to stop asking “what if,” and start being real about the data we’re seeing.
It’s time to put 2026 “on rails.”
Let’s get rolling:
Video transcript:
This is Moneyball Economics.
I’m Andrew Zatlin, and today it is a pleasure to share with you some data that you might not have seen, but this data is really cool.
It’s signaling where the US economy is going in 2026. It reinforces my view of why you should be bullish in the economy and the stock market, and it’s revealing a very significant trend underway.
Before I talk about this data though, I want to praise one other aspect of it, and that is that it is frequent. It comes out weekly and it’s current. It’s only a few days old when they release it. That’s key because if you want to know what’s going on today and therefore what’s probably going to happen in the near future, you want real time high frequency data and that’s a challenge.
It’s been a huge challenge, especially over the last year in general, if you’re relying on conventional data, the problem is it’s always not just backwards looking, it’s laggy.
We’re almost in March, we just got visibility to the December retail numbers. For example, the data that’s going to move the fed forward a few months old by the time they look at it, and that’s not the only problem. I mean now we’ve got government data. We had a shutdown that had us flying blind for the longest time.
Nevermind that, nevermind the fact that it’s old and it’s modeled and manipulated. It’s all talking about at the most recent December. I don’t care about December, that’s last year in December. Companies are winding down. I don’t care about the economic signals that may or may not be coming out of a company.
I want to know about what’s happening now as companies start ramping up.
Are they ramping up the same less than or more than last year?
I want to know what’s on their mind going forward, not how they were closing out the year.
And that’s the problem with relying on conventional data and that’s why I’m always out there looking for alternative data that can give me a better window into what’s happening today. The data I’m going to share with you is rail shipments, okay?
Every week there is a release that tracks how many rail cars, how much is shipped by the railroads for the past week, and it gets into some real nitty gritty data. We’re not going to go there. We’re going to stay a little bit higher level, 30,000 foot view.
But what’s cool about rail shipments and what you need to understand is that 70% or so of everything moved about in our country is moved on railroads. So we are really are getting a window into business activity overall. If you’re making stuff, well, you’re going to need chemicals. Guess what? Those chemicals are being shipped on railroads.
If you’re importing furniture, guess what?
It’s coming in on those containers on the ships.
It’s being offloaded at the port of LA, for example, and it’s being put onto a railroad car. That’s right. So railroads are telling us in real time whether or not the business activity is picking up or slowing down. So let’s talk about what is going on.
I took the weekly rail car shipments and I put them on a chart for you to look at, but let me explain one thing before we dive into the data. There are two kinds of rail shipments. There’s the kind that I just touched on. It’s called intermodal. It’s coming in as a container and it’s going point to point. Typically these are imports, right? They’re coming off at one mode and then they’re shifting to a railroad and then the railroad’s taking them to the next point.
So that’s intermodal multimodal, but then you’ve got just pure rail car shipments. That’s stuff that’s domestic. It was loaded on a rail car and now it’s moving. Could be grain, coal, could be cars, could be chemicals, whatever.
The key part here is for the most part, intermodal shipments are going to be imports, so you can track them. Rail car shipments are domestic, so you can track them separately. Let’s talk about what the headline that is telling us.
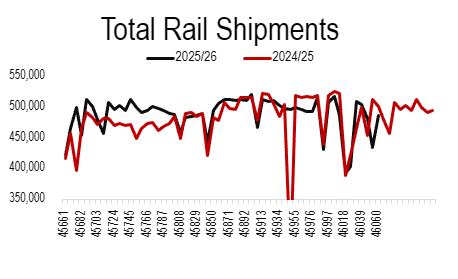
What I did is I took ‘24 and ‘25, the weekly data, and I laid it on top, but I also extended it. Hey, so I added that tail for 2024 and I added that tail a little bit. So you’re really getting two years plus six more weeks, so you’re getting the first six weeks of 2026. Alright, we’ve got a red line, we’ve got a black line.
The black line is pretty much the last 13 plus months compared to the prior 13 plus months, and what I want you to see, a couple things.
First of all, remember last year this time Trump comes running in, he’s going to do tariffs. Well, we claim that there was a lot of stockpiling, a lot of pulling in demand, a lot of inventory management, and guess what? That is exactly what happened.
As you can see from these charts, that black line suddenly bubbles up in March and April. That’s that pulling in of inventory.
Fast forward for the rest of the year, everything’s pretty much like the prior year, but all things being equal last year was pretty strong. The total amount of shipments by rail was 4% higher than it was the previous year. Is that low? Well, you could say that the tariffs created some tailwinds.
Maybe it would’ve been higher, but 4% still pretty solid, and that’s not inflation. That’s stuff that’s railroad shipments volume, so that’s a pretty positive story. That last year was actually stronger than 2024, but what does it say about 2026?
Now, if we look at the headline numbers 2026, the tails right there, it’s the same, right? It looks about the same as it was same period last year, and this is where I want to change things up.
So if the first takeaway is last year was pretty strong relative to the prior year, it could have been stronger without tariffs, but we’ll never know. But if that is the case that tariffs held us back, we’re a year past tariffs, and that means that this year, well, it’s going to stand on its own without those tariffs, and it could even be higher than that 4%, 10%, who knows where we’re going.
What I want to do though is add one more insight.
Remember I mentioned that we’ve got imports and domestically made stuff, and remember one of the key objectives of these tariffs is to start bolstering and onshoring of manufacturing. Trump really feels that we’ve got to make stuff more domestically than just importing it, and that’s what’s being played out because it’s working.
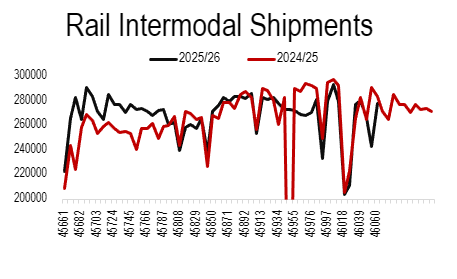
Let’s take a look. It’s six weeks into the year. It’s a little bit early, but look at how the data breaks out:

If we look at that intermodal, basically the import story, what you see is that for the first six weeks this year compared to the first six weeks last year, the amount of stuff being imported, and this is before tariffs, the amount of stuff being imported this year is lower than last year, and that again, is before this whole tariff front running move:

But if we look at stuff that’s made domestically, the rail car shipments, it’s a lot higher than it was last year, same period.
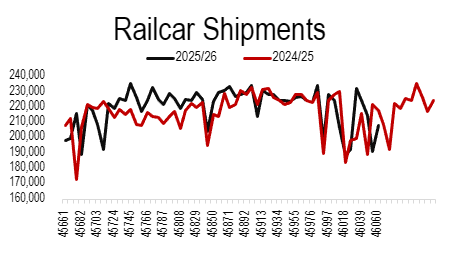
To me, what I’m seeing is the emergence of a trend that supports the premise that Trump one year after he started as president, is starting to enjoy the fruit of his labor with tariffs, that we are starting to see early signs of an emerging shift of production in the US.
Now, what does that mean for you and I as an opportunity if we’re going to see more domestic production?
Well, obviously the economy’s going to grow. It’s going to spin out a lot of things. Railroads are going to do well in this environment. A lot of places are going to do well warehousing and so forth. We’re going to see a lot more of the supply chain ramping up as the domestic economy grows.
Well, the stock market’s going to grow, obviously, and there are some interesting plays here.
As we get more and more demand for manufacturing, we’re going to get more and more demand for manufacturing payrolls for certain skills. We’re going to see a demand grow for welders, for electricians, you name it, and there are a couple plays to go with that because you’ve got to get technical certification.
We’re going to start seeing a ramp up, for example, in temp agencies. You’re going to grow manufacturing. That’s going to spin out some side jobs as well. Look for these opportunities as we start the year because we are ahead of the curve.
Everyone else out there is still looking backwards at December. They’re looking at last year’s economy. They don’t see that this year’s economy is already shaping up to be a bull run and where manufacturing’s coming online and you need to position accordingly. We’re in it to win it, folks.
Zatlin out.


Andrew Zatlin
Editor, Moneyball Economics