


This is the second time Joe Biden joins an administration amid a recession — offering a rare chance to look at performance rather than speculate about the first months of an administration.
For now, we know, “Pete Buttigieg is headed to [Department of Transportation] DOT’s top spot, where despite his thin transportation résumé, the smooth-talking former heartland mayor could help President-elect Joe Biden sell Congress on a massive job-creating investment in infrastructure that would also attempt to blunt the effects of climate change.”
Biden’s stimulus effort seems similar to the plan in 2009 when the Obama administration pushed a major infrastructure stimulus bill.
Within a year, the administration was claiming, “The Recovery Act has already funded tens of thousands of projects and put about 2.5 million Americans to work, but summer 2010 is actually poised to be the most active Recovery Act season yet, with tens of thousands of projects underway across the country that will help to create jobs for American workers and economic growth for businesses, large and small.”
Such a massive accomplishment must show up in the data. But the chart below shows that’s not the case.
Total Public Construction Spending

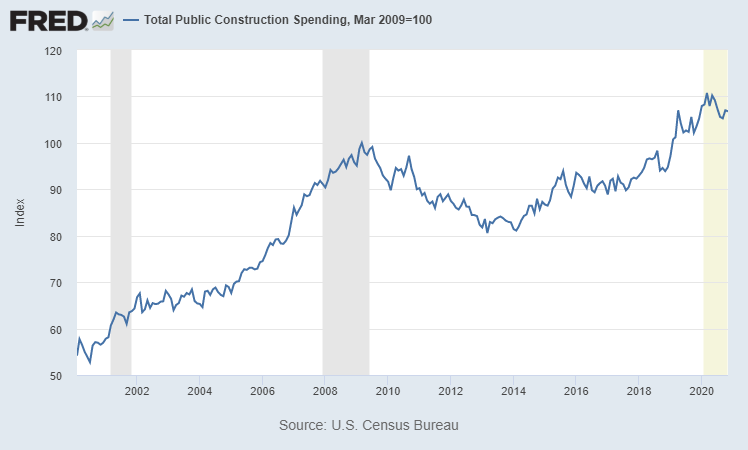
Source: Federal Reserve.
Wasted Stimulus Spending in the Past
The chart shows infrastructure spending, the total amount of money spent by the public sector on construction projects — including roads and highways along with buildings. The chart is scaled to show a value of 100 in March 2009, a month after President Obama signed the American Recovery and Reinvestment Act.
Spending declined for four years after Biden took charge of the stimulus. Long forgotten is the fact that spending included signs costing up to $4,000 each.

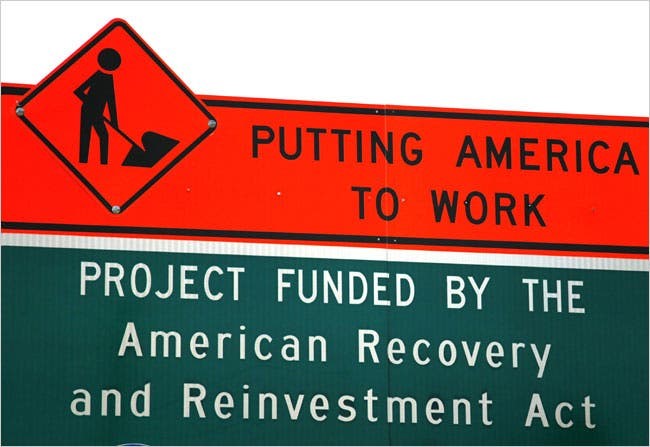
Source: NYTimes.com.
It’s possible that sign money could have been used for road work, but Biden set the priorities for the Recovery Act.
This time, look for more of the same with declines in spending on roads and building even as the budget deficit soars. On the bright side, this could be the ideal time to invest in sign makers.
Michael Carr is a Chartered Market Technician for Banyan Hill Publishing and the Editor of One Trade, Peak Velocity Trader and Precision Profits. He teaches technical analysis and quantitative technical analysis at the New York Institute of Finance. Mr. Carr is also the former editor of the CMT Association newsletter, Technically Speaking.
Follow him on Twitter @MichaelCarrGuru.