


Stocks are moving up.
Given recent bullish market action, it’s reasonable to ask how high prices can go.
Analysts use many tools to find S&P 500 price targets — or targets in general. Some techniques are complex. Others are esoteric. In market analysis, as in all things, Occam’s razor should apply.
Occam’s razor is the idea that when there is more than one way to solve a problem, the simplest solution is usually the best.
The chart below applies one of the simplest price projection tools to the SPDR S&P 500 ETF (NYSE: SPY). It shows SPY, which tracks the S&P 500 Index overall, should reach a new all-time high before the current uptrend ends.
S&P 500 Trending Toward New Highs

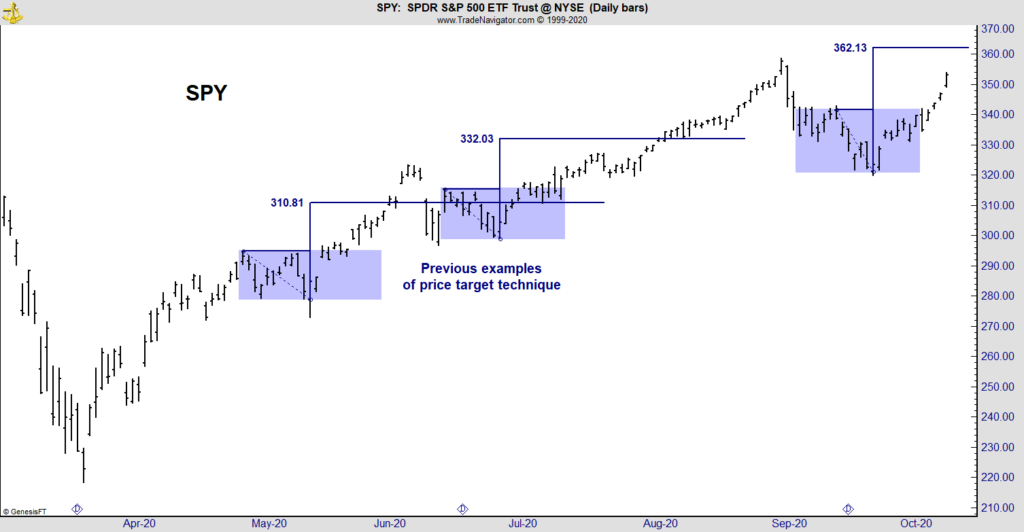
Source: Trade Navigator.
The chart includes two prior examples of this S&P 500 price target projection tool. In both cases, SPY met the target.
A Simple Way to Track the S&P 500 Price Target
The first step to finding a target is to identify a trading range. In a trading range, prices move back-and-forth for at least a week, failing to break a previous high at least once.
When this area is identified on the chart, the distance between the high and the low can be measured. This difference is added to the high to obtain a price target.
Technical analysts often use this technique. They argue that the momentum of the breakout will carry prices a distance at least equal to the depth of the trading range. It’s a simple idea, and the chart above shows that it often works.
Other price tools also rely on this principle of symmetry. Chart pattern price objectives use this approach. Extreme moves above or below a moving average are often followed by a move of similar size in the opposite direction.
Technicians have applied this technique for decades. It works often and is worth following.
Right now, this tool says a new high is likely. Traders should wait for that before taking bearish trades in the market.
Michael Carr is a Chartered Market Technician for Banyan Hill Publishing and the Editor of One Trade, Peak Velocity Trader and Precision Profits. He teaches technical analysis and quantitative technical analysis at New York Institute of Finance. Mr. Carr is also the former editor of the CMT Association newsletter, Technically Speaking.
Follow him on Twitter @MichaelCarrGuru.