


Over the past few years, the market’s biggest “Big Tech” stocks have dominated both market returns and financial headlines in a way that no group of stocks has before.
Dubbed the “Magnificent Seven” by investors (Apple, Amazon, Alphabet, Meta, Microsoft, Nvidia and Tesla), these stocks account for a staggering 37% of the S&P 500. Back in 2023, they were responsible for 63% of the index’s positive performance.
The numbers are simply mind-blowing. And that, in turn, makes for great headlines and articles in the media.
But therein lies the problem…
You see, human beings are driven by narrative. We understand our world through stories, and we’re attracted to novelty. So when Elon Musk promises self-driving cars, or when Microsoft execs announce a plan to build out nuclear power plants, we’re naturally drawn to that news.
Those execs are well aware of the power of positive media attention, so they’re always keen to keep the headlines rolling. Elon especially is a master of spinning the media.
And in all that excitement, we somehow forget that the market is made up of more than just those seven stocks.
That’s one of the reasons Adam and I have harped on the mantra “look where no one else is looking.”
In a deep dive, I found something surprising.
It’s tech-related, but not what you might think.
Let’s dive into it…
Market’s Best Opportunities Hiding From the Spotlight
What if I told you a basket of stocks (including tech) was outperforming the combined performance of those seven stocks?
You’d likely take notice.
EWY Outpaces Magnificent 7
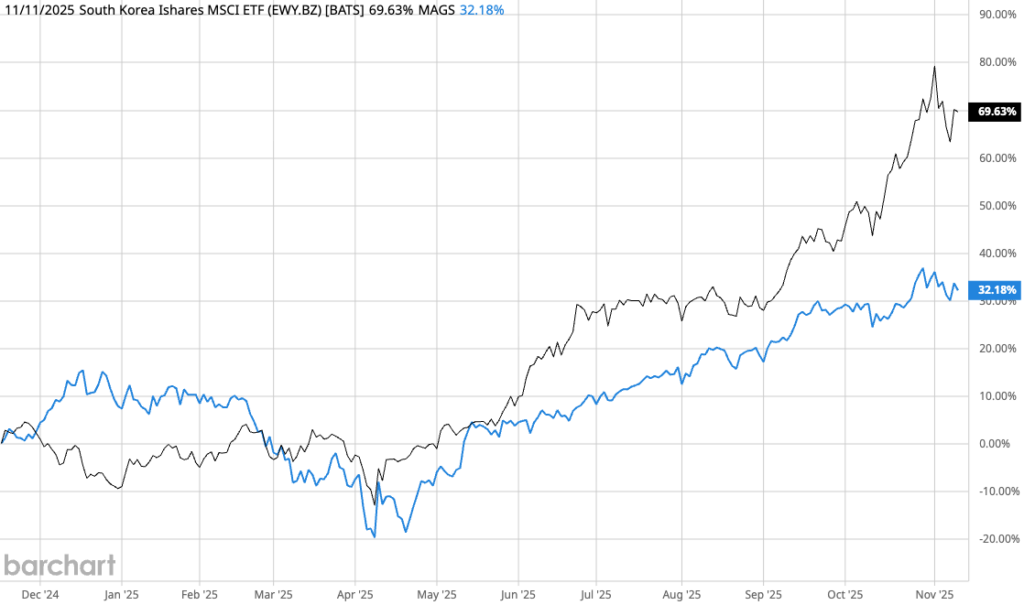

In the chart above, the black line represents the iShares South Korea ETF (EWY), while the blue line is the Roundhill Magnificent 7 ETF (MAGS).
Over the last 12 months, EWY has gained nearly 70%. The Magnificent 7 ETF… just 32%.
That means the South Korea ETF has outperformed the Magnificent 7 ETF by more than 2x.
EWY is primarily a technology play with Samsung Electronics comprising 23% of the fund.
Have a look at the chart with some changes…
EWY Trading Above 50-Day and 200-Day Moving Average
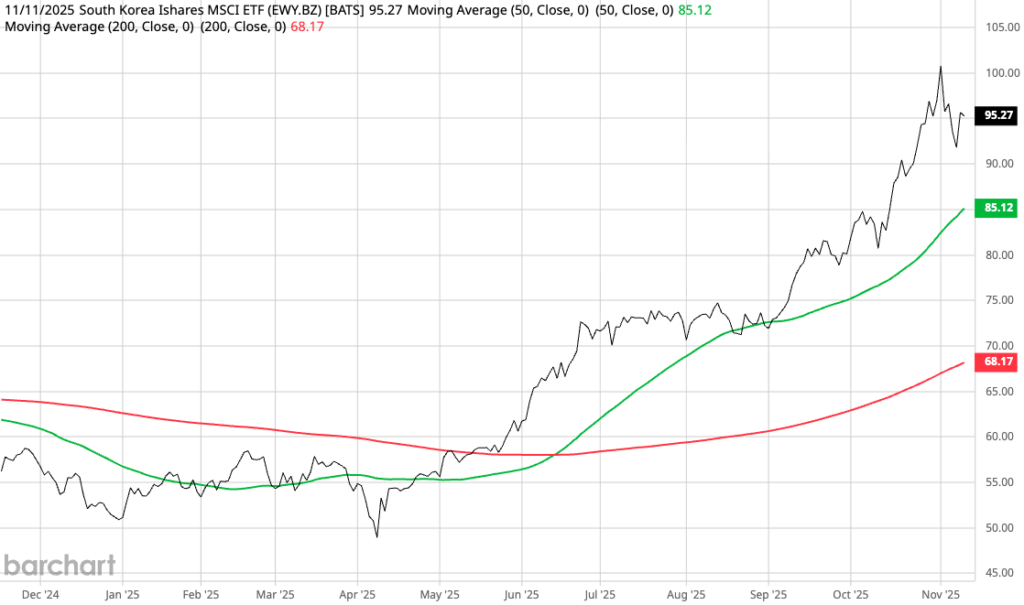

I added EWY’s 50-day (green line) and 200-day (red line) simple moving averages.
Notice the “golden cross” where the 50-day average crosses over the 200-day average. That simple technical indicator would trigger a potential buying opportunity.
I mention that because, under normal circumstances, I would run EWY through what we call an X-ray, where I break down the ratings of every holding in Adam’s Green Zone Power Ratings system.
However, a large majority of the 83 holdings are only Korean-traded stocks and don’t rate on the system.
Therefore, you would need to use a more technical indicator to find your buy signal.
Which leads me to another surprise…
What if I told you there was an indicator that triggered a buy more than a month before EWY hit a “golden cross”?
Adam’s proprietary Kinetic Profits Indicator triggered a buy signal on EWY in the first week of May, when the ETF was starting to break out of its 52-week low.
If you had bought at the “golden cross” trigger, you’d have a nice 42.6% gain on EWY.
However, if you followed Adam’s Kinetic Profits Indicator, that gain would be 62.4%.
The bottom line here is two-fold:
- There are other compelling ways to gain exposure to the global bull market beyond the Magnificent 7 stocks.
- A proven technical indicator, like Adam’s Kinetic Profits Indicator, can find these hidden gems, even before the broader market does.
To learn more about Adam’s Kinetic Profit Indicator (including how you can plug the system directly into your own stock research) just click HERE.
That’s all from me today.
Until next time…
Safe trading,


Matt Clark, CMSA®
Chief Research Analyst, Money & Markets