


If you spent June watching the S&P 500 Index and nothing else, you probably shrugged.
The index finished the month at 7,499.36, down just 80.70 points, or 1.1%. A rounding error. A yawn. The kind of month that doesn’t earn a mention the evening news.
But the S&P 500 has always been a master illusionist. And in June, it pulled off one of its oldest tricks: keeping your eyes fixed on an index that barely moved while something far more dramatic unfolded beneath the surface.
Because underneath that modest 1.1% dip, the biggest companies in America quietly shed more than $2.3 trillion in market value.
That’s trillion, with a “t.”
At the very same time, the market’s smallest, least glamorous stocks were quietly off to the races.
If June had a real headline, it wasn’t “Market Takes a Breather.”
It was “The Giants Stumbled – and the Little Guys Took the Lead.”
Let me show you what I mean.
The Tale of the Tape
Here’s the first thing that should catch your eye.
In a month where the S&P 500 slipped 1.1%, the Dow Jones Industrial Average climbed 2.5% — up more than 1,286 points to 52,319.20.
And the Russell 2000, the small-cap index most investors treat like a rounding error, jumped 3.6% to 3,024.37.
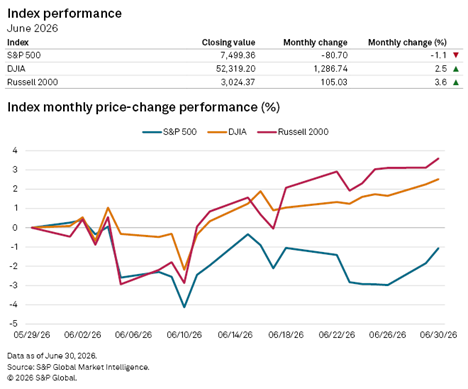

Think about that. The headline index went down. The other two major indexes went up — and the small-cap benchmark led all three.
When the big index and the small index move in opposite directions like that, it’s not noise. It’s a signal that something is rotating under the hood.
And the S&P 500 family tree tells the same story even more clearly.
Slice the market by size, and the divergence is almost comical: the small-cap S&P 600 finished June up roughly 7%, the mid-cap S&P 400 up around 3.5%, while the large-cap S&P 500 lagged at down about 1%.
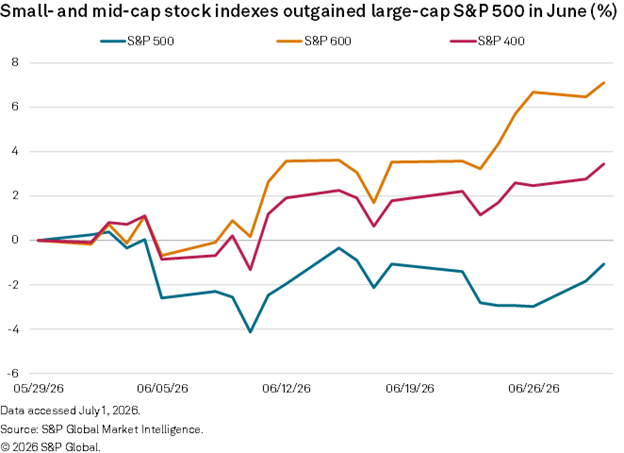

Same country. Same economy. Same 30 days. The only difference was size — and in June, smaller was better. A lot better.
Where All That Money Went
So if the small- and mid-cap stocks were winning, who was losing? The names you’d least expect — the ones everybody owns.
Eight of the largest stocks in the S&P 500 combined to lose $2.321 trillion in market cap between May 29 and June 30. And the roll call reads like a who’s-who of the last decade’s winners:
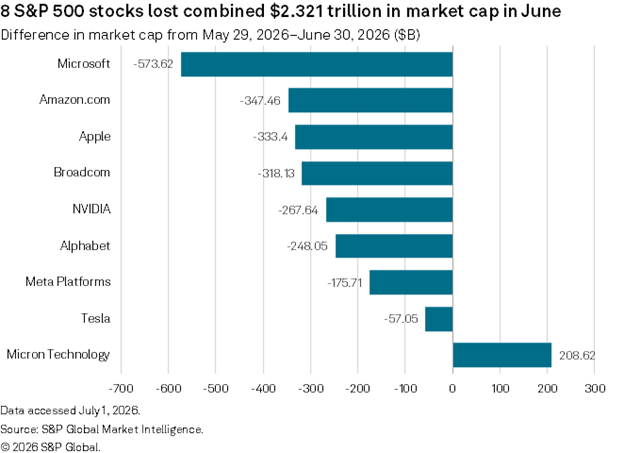
Here’s how some of the largest companies in the S&P 500 fared during the month:
- Microsoft (MSFT) led the bleeding, shedding a staggering $573.62 billion — more than the entire market cap of most companies on Earth.
- Amazon (AMZN) dropped $347.46 billion.
- Apple (AAPL) gave back $333.4 billion.
- Broadcom (AVGO) lost $318.13 billion.
- Nvidia (NVDA) $267.64 billion.
- Alphabet (GOOGL) $248.05 billion.
- Meta Platforms (META) shed $175.71 billion.
- Tesla (TSLA), already a shell of its former self, coughed up another $57.05 billion.
One name — just one — bucked the entire group. Micron Technology (MU) added $208.62 billion in market value while its mega-cap neighbors were getting hauled off in stretchers.
That’s the whole story in a single chart.
Money didn’t leave the market in June. It just changed seats — out of the crowded mega-cap trade and into the corners of the market nobody was bragging about at dinner parties.
What the Ratings Were Telling Us All Along
Now here’s where it gets interesting — and where our Green Zone Power Ratings system earns its keep.
If you’d been watching the ratings instead of the headlines, June’s shakeout wouldn’t have surprised you one bit.
The system rates stocks from 0 to 100. Anything above 60 is “Bullish” green. The 40-to-60 band is neutral yellow. And below 40 is the red zone — the place you don’t want your money sitting.
A quick note on the chart below: the columns run backward in time, from one month ago out to a year ago. So even the “1 month ago” reading isn’t today’s number — it’s a snapshot heading into the stretch we’re talking about.
The point isn’t the exact figure on any given day. It’s the trajectory — the direction each stock was already heading before the losses landed.
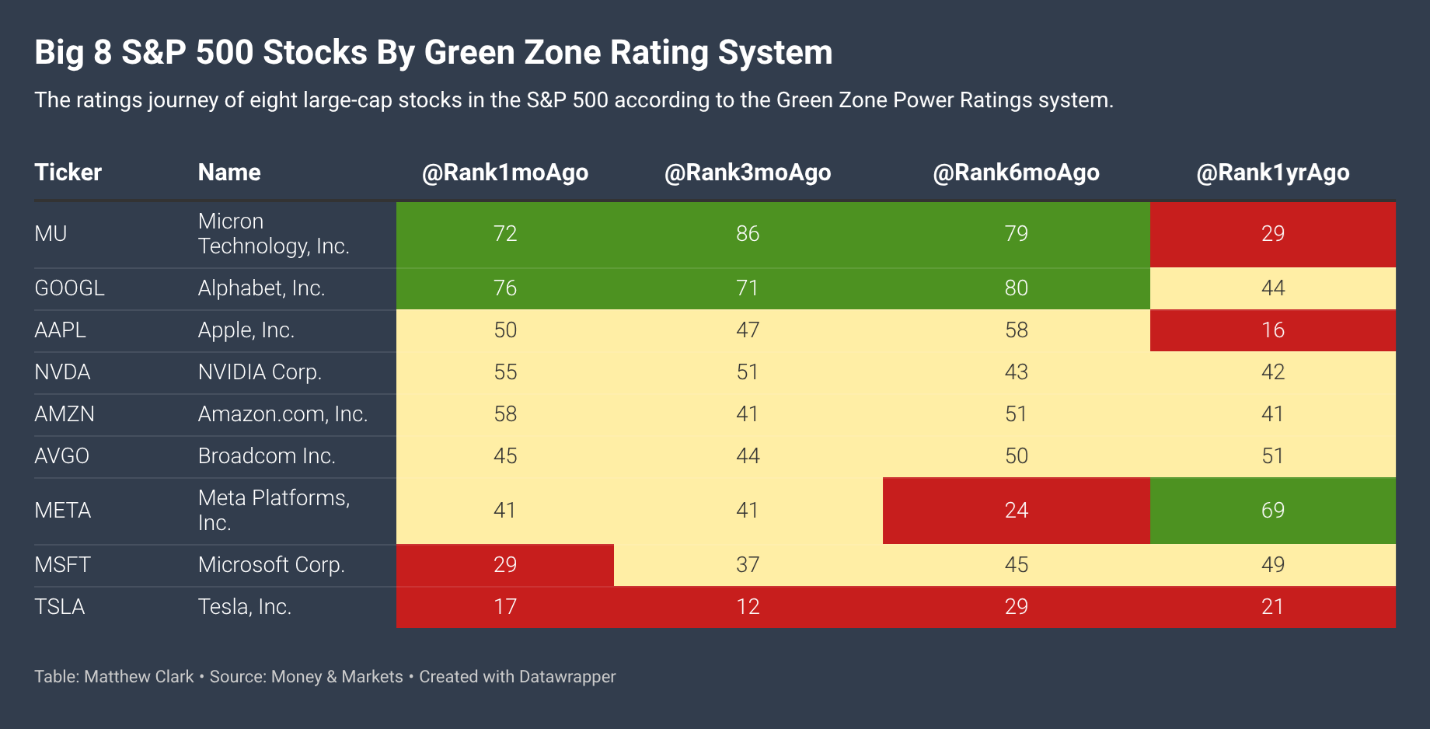

Look at the two stocks that got hit hardest, and the picture snaps into focus.
Microsoft, which lost more market cap than any company in America last month, had been sliding in our ratings for a year, from 49 a year ago to 45, then 37 and down to a red-zone 29 a month out.
The rating didn’t just call the drop after the fact. It had been backing away from Microsoft throughout the decline.
Tesla tells the same story, only worse.
It had been marooned deep in the red the entire stretch — 21 a year ago, 29, then 12 and 17 a month ago. The market finally caught up to what the rating had been screaming all along.
Meanwhile, guess who sat near the top of the board?
Micron — the one name that gained value in June — carried a Bullish 72 a month out, up from a red-zone 29 a year earlier.
That’s the kind of round trip that makes you money. Alphabet held its ground in the mid-70s, and it was the least-punished of the mega-cap group by a wide margin. The ratings weren’t lucky. They were early.
The rest of the mega-caps sat exactly where you’d expect the walking wounded to sit — stuck in neutral yellow. Nvidia in the mid-50s, Amazon in the high-50s, Broadcom and Apple in the mid-40s to 50, Meta at 41.
Not bad enough to run from, not good enough to back up the truck.
And remember, those readings are already a month stale — the freshest numbers, the ones that will show how far this rotation has run, aren’t on the board yet.
This is a polite way of saying the era of blindly owning the biggest names and calling it a strategy may be running out of road.
The Takeaway
June wasn’t a boring month. It just wore a boring disguise.
The market didn’t sell off — it rotated.
The trillions that left Microsoft, Apple, Amazon and the rest didn’t vanish. A big chunk of it went looking for value in small- and mid-cap stocks that had been left for dead.
And the stocks that held up best, like Micron and Alphabet, were the ones our ratings had been pointing to all along.
This market keeps trying to teach us the same lesson: the S&P 500’s headline number is the least useful thing you can look at.
The real action is always underneath — in which stocks are gaining strength and which are quietly losing it. Watch the ratings, not the rounding errors.
In June, that difference was worth $2.3 trillion.
Until next time…
Safe trading,


Matt Clark, CMSA®
Chief Research Analyst, Money & Markets
P.S A rare shift is taking shape beneath the surface of today’s market – and What My System Says Today editor Adam O’Dell believes it has opened the door to one of the most exciting opportunities he’s uncovered in years.
That’s why he’s going LIVE on Thursday at 1 p.m. to walk through the unique market setup that’s creating what he believes could become one of the biggest breakthroughs of his career – a new income strategy designed to help everyday investors generate extra cash payouts amid today’s market chaos.
The opportunity is still unfolding, and investors who understand what’s happening now will have a significant advantage in the weeks and months ahead.
If you want to see the research behind the strategy and the #1 move you must make immediately to capitalize on this setup, click here to automatically reserve your spot.