


I’m not going to mince any words.
The current state of the market is that of volatility and uncertainty.
As any smart investor would, you are looking for an edge … an indicator … anything that might give you a leg up in navigating all of this.
I, for one, am technical and systematic.
But the thing is, I don’t look at every technical indicator out there because there are hundreds of them.
In fact, I have an 800-page book on my shelf titled Technical Analysis Explained. You simply need that much space (if not more) to explain how each of these indicators works.
But as I’ve studied over the years, I’ve discovered what I should be watching for.
I’ll get to what I found in a second, but first, I want to provide a little context.
Foundation of Technical Analysis
You may have never heard of John Welles Wilder Jr., but his work is paramount to modern technical analysis.
After serving in the U.S. Navy during the Korean War, Wilder studied to be a mechanical engineer at North Carolina State University.
He spent seven years in the field before pivoting into real estate and land development.
But, the engineer in him never really left. He was always looking for ways to optimize and outperform.
By age 38, he said he had all the money he needed and nothing to do, so he began studying and trading commodities. In an interview with Traders Log, he mentioned: “They are even more highly leveraged than, like, real estate.”
Years of study led him to write his first book, New Concepts in Technical Trading Systems, where he introduced the concept of the relative strength index (RSI).
At its heart, RSI is a technical indicator that gauges market momentum and identifies overbought and oversold conditions.
Traders have used RSI to pinpoint times when to get into a stock and when to get out. It’s also used to manage risk and potentially avoid losses.
That brings me to what I discovered this week…
Flashing the Buy Signal
RSI has two components:
- A line indicating when a stock is overbought.
- And a line indicating when it is oversold.
When a stock or index’s RSI hits above 70, it is considered overbought. When it drops to below 30, it is oversold.
Being overbought is thought of as an exit point for a position, and oversold is an entry point.
S&P 500 Flashes Oversold RSI
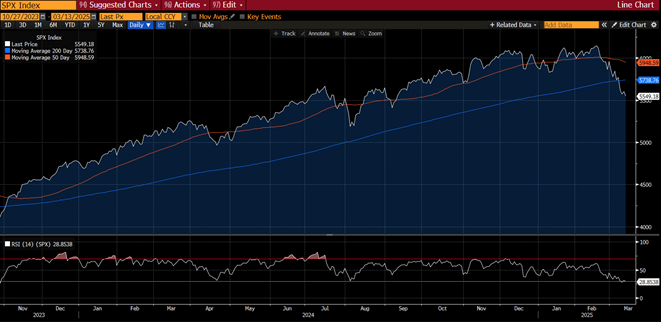

The top part of this chart is the price movement of the S&P 500 over the last 12 months.
The index’s 14-day RSI is at the bottom of the chart. The red line is the “overbought” line, and the green is the “oversold” line.
If you look all the way to the right of the RSI chart, you’ll see its reading is just below 30, indicating an oversold position.
While the index has touched the 30 mark before, this is the first time it has gone below 30 since October 2023.
If you look closely, each time the RSI has reached 30, the index has rallied.
In fact, the last time the S&P 500’s RSI was below 30 was at the end of October 2023. The index climbed 16% in the following 3 months.
And it might be happening again now. After hitting correction territory on Thursday (a 10% fall from recent highs), the S&P 500 is trending higher again in early trading this morning.
It will be interesting to see if history repeats itself this time around.
Now, I don’t suggest you take one indicator by itself to determine whether you buy or sell a stock.
But this reading of the S&P 500’s RSI could be a turning point to what has been a difficult 2025.
That’s all from me today. Have a great weekend!
Until next time…
Safe trading,


Matt Clark, CMSA®
Chief Research Analyst, Money & Markets