


When the Bureau of Labor Statistics released the latest weekly report on new claims for unemployment insurance, skeptics screamed “fake news.”
Headlines like, “Initial jobless claims fall, but drop tied to change in statistical method” appeared on financial news sites. Many analysts said the data is not directly comparable to past data.
The implication is that government economists changed the process to make the data look better.
Even if true, the change was technical. And historical data shows change was needed.
The chart below shows recent trends in seasonal adjustments. The blue line is the difference between the seasonally adjusted number and the raw data. Since the last recession ended, there has been a clear trend with lower highs in the difference every year and higher lows.
Unemployment Seasonal Trends

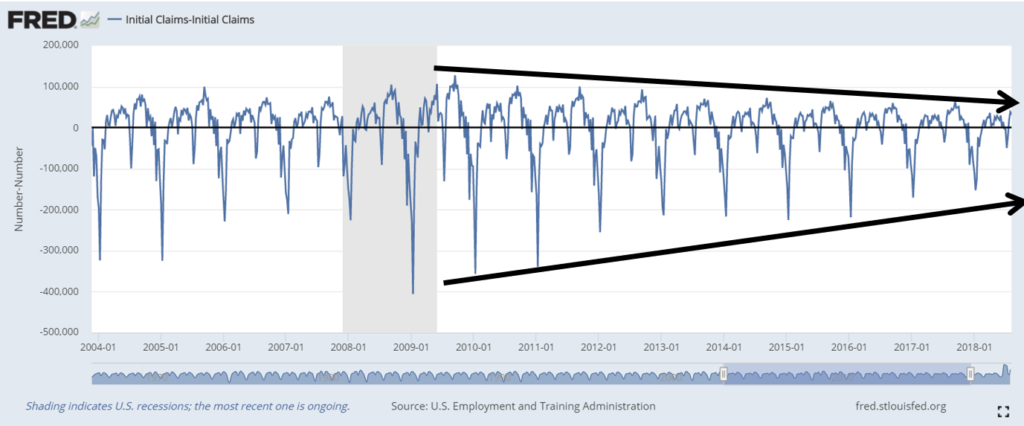
Source: Federal Reserve
This chart shows data through August 2019 to avoid the large spike in unemployment caused by the economic shutdown earlier this year.
The trend in the chart is persistent over years. And it shows a change to the seasonal adjustment process was needed.
Adjusted data raises concerns for many. But adjustments are needed because the data fluctuates season-to-season.
As an example, in most years, there would be a larger than average number of people hired in early September. There’s a simple reason for that. Teachers and support staff are hired as schools reopen.
In a normal year, many of those new hires are the same people who filed new claims in June when school started summer breaks. Another spike occurs during the holidays when retailers and delivery companies hire and then lay off hundreds of thousands.
Seasonal adjustments are necessary. And the process in use since the last recession needed to be updated.
There is no conspiracy. There is just better data.
Michael Carr is a Chartered Market Technician for Banyan Hill Publishing and the Editor of One Trade, Peak Velocity Trader and Precision Profits. He teaches technical analysis and quantitative technical analysis at New York Institute of Finance. Mr. Carr also is the former editor of the CMT Association newsletter Technically Speaking.
Follow him on Twitter @MichaelCarrGuru.