


I saw an interesting report yesterday from Morgan Stanley.
In it, the Wall Street bank estimated companies in the S&P 500 could shave $920 billion from their budgets in the coming years by integrating more “agentic” artificial intelligence (AI) software and robotics.
Agentic AI is a system designed to work autonomously with very little human interaction.
Think of it as the chatbot you first interact with when contacting customer service on your bank or electric company’s website.
The benefit of agentic AI is that it is designed to make independent decisions, learn from its environment and even adapt to different conditions.
The savings for S&P 500 companies would come in the form of lowering payroll expenses by reducing the need for humans to do repetitive or process-heavy roles.
This projected savings accounts for about 28% of the index’s 2026 pretax earnings.
These efficiencies and cost savings will bode well for bottom lines and, eventually, share prices… especially for the tech sector supplying AI and the industries aggressively using it.
However, I also encountered something a bit more concerning related to the technology sector of the market.
Something that could have reverberations across, not just the sector, but the market as a whole…
Underrated But Important … Tech Valuations Tell A Tale
Unless you’re Warren Buffett, many investors only pay slight attention to a company’s value.
If more did, the tech-heavy Nasdaq Composite Index wouldn’t have risen nearly 55% in the last two years. The S&P 500, which tracks many of these same mega-cap tech stocks, is up 43% over the same time.
Stock value is typically determined by dividing the price of a stock by its earnings, sales or book value. These ratios help determine if a stock is considered overvalued or undervalued.
There’s a trend when it comes to the tech sector and value:
Tech Sector P/E Ratios Climbing
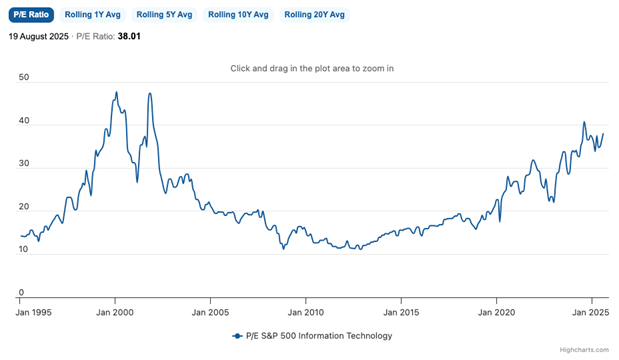

Despite a few short blips, the S&P 500 information technology sector’s price-to-earnings (P/E) ratio has been climbing since 2012.
Today, the sector’s P/E ratio is 38.01. It’s not the highest it’s been, but it continues trending higher.
Investors are projecting significant earnings growth in the tech sector’s future. They’re willing to pay a hefty premium for each dollar of those earnings.
That sounds good. However, overvaluation can stem from market enthusiasm that outpaces actual performance. In this case, tech enthusiasm can be traced back to AI innovations.
When that enthusiasm doesn’t match performance, the bubble pops and those once overvalued stocks tumble.
It’s happened before, and now, the table is set for a similar ending…
Partying Like It’s 1999
The last time the tech sector was hit by its overvaluation was in 1999-2000.
It was the height of the dot-com era when tech stocks were soaring over the excitement of the internet.
The information technology sector’s average P/E ratios ballooned to nearly 50 as investors bet on dot-com companies continuing to raise funds and increase profits.
This boom carried the S&P 500 and Nasdaq to all-time highs.
The problem was that funds dried up, and many of these companies lacked the profits to sustain their operations.
The bubble finally burst in March 2000. Two years later, the Nasdaq was down 78% from its highs — giving away all of its gains from the rise.
Now, look at this chart from Apollo Global Management…
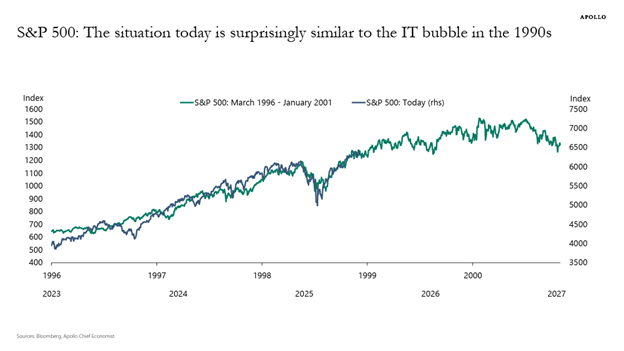

The green line shows the S&P 500’s performance from March 1996 to January 2001, and the blue line shows its performance from 2023 to today.
It’s hard to tell the two lines apart, right?
To get a better idea of where the tech sector currently stands, I wanted to examine it using Adam’s Green Zone Power Rating system.
Ratings Confirm Struggles for Big Tech
To complete this analysis, I conducted an “x-ray” of the SPDR S&P 500 Technology Sector ETF (XLK).
What I uncovered was interesting, to say the least…
S&P 500 Tech ETF Rates “Bearish”
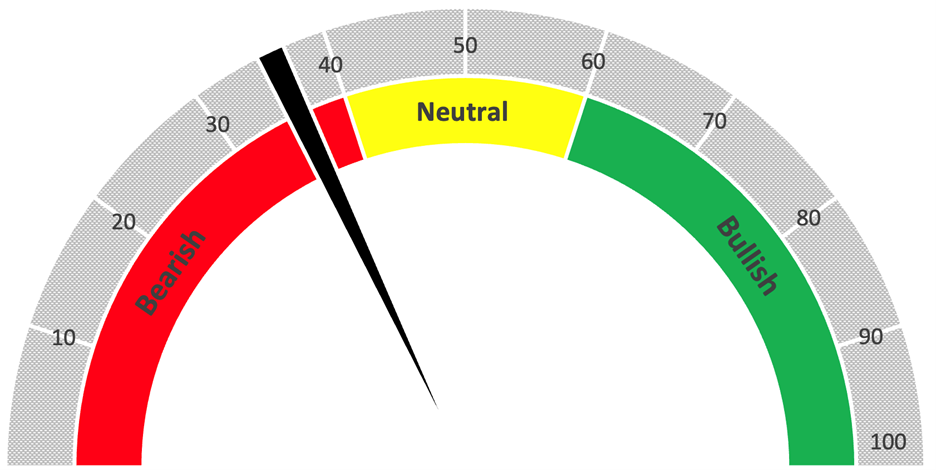

The average rating of all the stocks in the ETF is a “Bearish” 36 out of 100. Only six of the 70 stocks were rated in the green.
Here are the average scores by factor:
- Momentum: 47.
- Size: 8.2 (not entirely surprising since this is the S&P 500).
- Volatility: 37.
- Value: 25 (the second lowest factor rating, just ahead of Size).
- Quality: 80.
- Growth: 67.
Specific to Value, only three stocks in the ETF rated above 60. All three of those stocks, however, were no higher than 78 on the factor.
This “x-ray” tells me that momentum is not as strong as it once was in the sector, and it is highly volatile.
But companies are doing well with returning profits from assets, equity and investment. Margins also remain solid.
However, the sector is becoming (if it isn’t already) overvalued.
This standing in the Green Zone Power Rating system tells me to tread lightly when it comes to tech sector stocks, especially with funds like XLK that track the biggest of Big Tech. There are still opportunities out there, but the days of just buying the “Magnificent Seven” and ignoring your portfolio for months are gone.
Until next time…
Safe trading,


Matt Clark, CMSA®
Chief Research Analyst, Money & Markets