


Myths are common in the investment world.
A popular myth is that stocks return an average of 10% a year, but I busted that one yesterday.
Today, I want to address the myth of diversification.
Diversification is achieved by allocating investments across different asset classes. A popular strategy is to allocate 60% of a portfolio to stocks and 40% to bonds. More sophisticated strategies include more asset classes.
In theory, diversification reduces risk because different assets should have different reactions to news events. Holding bonds, for example, should reduce losses when stocks decline.
The chart below shows the long-term performance of different classes. It’s based on data in a paper called “Historical Returns of the Market Portfolio.”

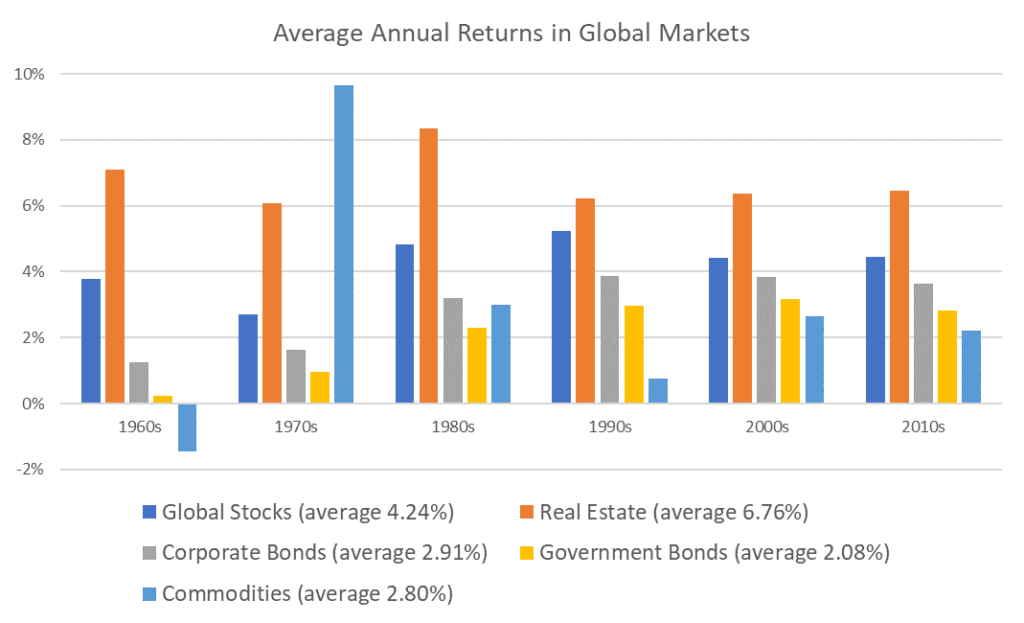
How Diversification Has Changed Over the Years
Based on the chart, it appears real estate provides the largest and steadiest returns since 1960.
Bonds performed well since interest rates peaked in the 1980s. If rates rise, returns are likely to be low as they were in the 1960s and 1970s. Corporate bonds carry greater risk than government bonds, which explains their outperformance.
A broad basket of commodities was volatile with losses in the 1960s, large gains in the 1970s and low returns since then. Individual investors may find an allocation to gold offers better diversification than a broad basket of commodities.
Stocks were consistent performers offering returns averaging about 4%. This is a global stock market index, and individuals may find a single-country index like the S&P 500 is a more suitable investment.
Diversification worked best in the distant past. In the last three decades, returns have been relatively steady.
The studies that created the myth of diversification relied on the 1970s, when commodities offset low returns in the stock market. If that happens again, diversification will pay off. Otherwise, this strategy for reducing risks will only lower returns.
Michael Carr is a Chartered Market Technician for Banyan Hill Publishing and the Editor of One Trade, Peak Velocity Trader and Precision Profits. He teaches technical analysis and quantitative technical analysis at the New York Institute of Finance. Mr. Carr is also the former editor of the CMT Association newsletter, Technically Speaking.
Follow him on Twitter @MichaelCarrGuru.