


Economies all around the world are suffering in the wake of the pandemic.
But the suffering isn’t equally distributed. Some countries experienced steeper declines in GDP than others. The recovery will also be uneven with some countries bouncing back relatively quickly.
China’s GDP, for example, is expected to grow by about 2.7% this year. That’s less than half of last year’s rate, but China will be one of the few countries posting any growth in 2020.
South Korea and Taiwan had some of the best responses to the coronavirus. Their economies are also on track for relatively rapid recoveries.
These three countries have the largest representation in the iShares MSCI Emerging Markets ETF (NYSE: EEM).
From a technical perspective, EEM is a buy.
A Bullish Trend for EEM

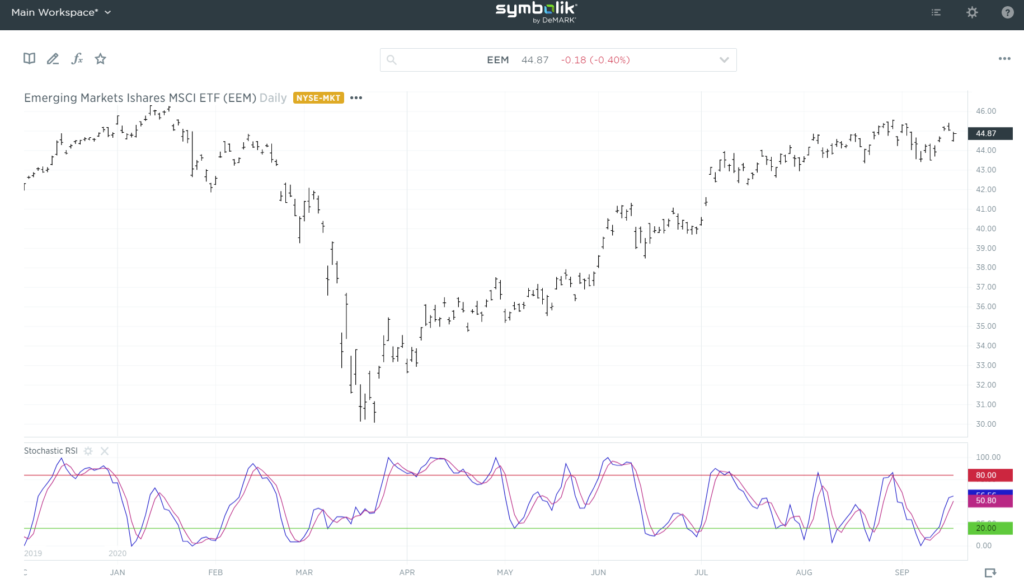
Source: Symbolik
The ETF is trading near 52-week highs. Technical analysts would consider a breakout bullish. Based on the recent trading range, a conservative price target is $48, a gain of about 7%.
The momentum indicator at the bottom of the chart confirms the bullish outlook.
This indicator is the stochastic relative strength index (RSI). It’s calculated by comparing the RSI indicator to its recent range. It provides context for the current momentum.
This indicator turned up ahead of the bottom in March and before the bullish breakout in July. Its recent bottom suggests higher prices are likely in EEM.
Emerging Markets Are a Solid Investment Now
Fundamentally, some analysts see emerging market equities as the sole bright spot in their long-term forecast.
Federal Reserve policy also supports EEM. The Fed’s decision to keep short-term interest rates at zero for at least the next three years means the U.S. dollar will be less attractive to traders who want higher yields in other currencies.
This is good news for stocks in emerging markets since traders are more likely to sell dollars so they can invest in those markets.
The bottom line is that emerging markets are likely to outperform the S&P 500 for at least the next few months. The EEM ETF provides a convenient way to invest in the strongest of the emerging markets.
Michael Carr is a Chartered Market Technician for Banyan Hill Publishing and the Editor of One Trade, Peak Velocity Trader and Precision Profits. He teaches technical analysis and quantitative technical analysis at New York Institute of Finance. Mr. Carr also is the former editor of the CMT Association newsletter Technically Speaking.
Follow him on Twitter @MichaelCarrGuru.