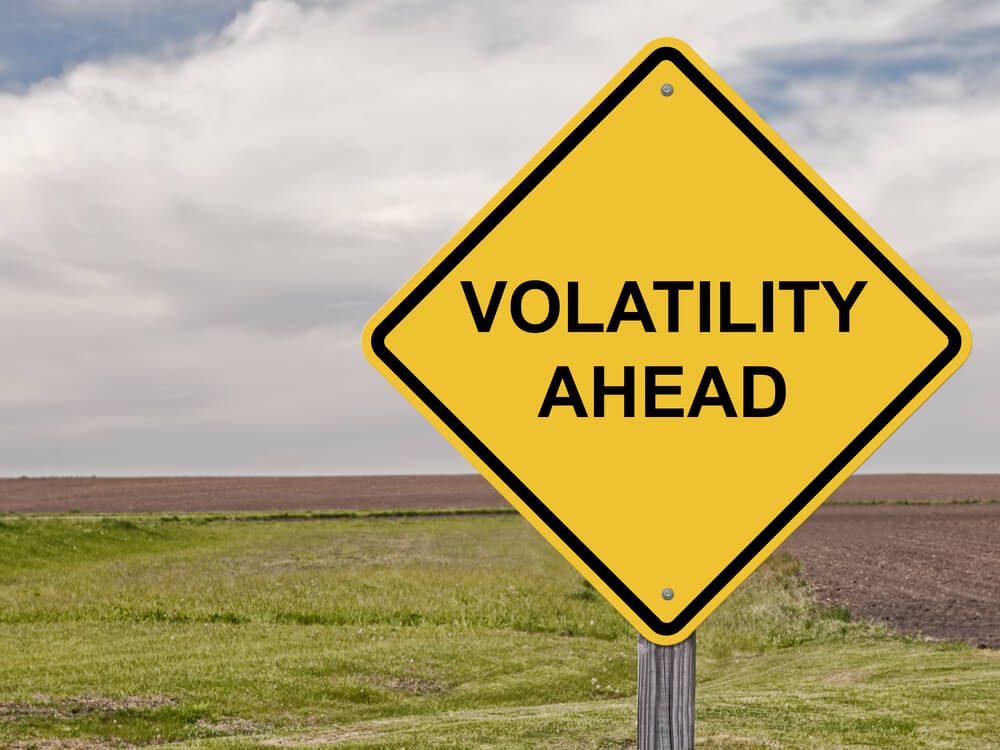
Major market gains over the first three months of 2019 have recouped much of what was lost during Q4 of 2018, particularly during December’s bloodbath.
The Dow Jones is now 900 points shy of its previous record high, the S&P 500 is 3% shy of its record high and things are looking great, right?
Not so fast.
According to Chantico Global CEO Gina Sanchez, investors should be wary of the market bounce because there are plenty of troubling developments still in play.
Per CNBC:
“We’re back to the levels as if the December decline never happened and I think what’s interesting is what’s pushing that is the Fed has decided to not hike for the rest of 2019 and only once in 2020. Now that is a double-edged sword, that’s a canary in the coal mine,” Sanchez said Monday on CNBC’s “Trading Nation ” segment.
After the fourth rate hike of 2018 hit in December and with the prospects of two more hikes planned for 2019, the Fed suddenly turned dovish, signalling no rate hikes for 2019. The Fed is preaching patience, but Sanchez says its pause is a major warning sign of a coming recession.
“Look at economic surprises that are deeply negative right now, economists continue to ratchet down their expectations for growth in 2019 and growth in 2020, and we did see the yield curve flashing a negative sign,” she said.
While Sanchez does see trouble ahead, she said investors could still squeeze returns out of the market, at least in the near term.
“Earnings are still cycling high because of the tax cut,” she said. “That will buoy the market for some time but I think at some point we’re going to have to face the fact that we’re on the back end of this extension of the markets and we’re headed for a downturn at some point, but this rally could continue for a couple of quarters.”
The stock market flashed one bullish signal to begin the second quarter: a golden cross, where its 50-day moving average crosses above its 200-day moving average, indicating a change in trend. The last time that happened in mid-2016, the S&P 500 rallied roughly 15 percent in 12 months.
Ari Wald, head of technical analysis at Oppenheimer, sees a far more bullish underlying signal in the market.
“We prefer looking at internal breadth indicators. I think that’s where the value add is when talking about technical measures. Looking at the participation of the market, typically rallies with many stocks participating are the rallies that can continue; those with more narrow participations are the ones that are prone to reverse,” said Wald during Monday’s segment.
“One great tool to look at is the NYSE advance-decline line. It made a new cycle high in February, close to making yet another one. It’s something we’re going to be watching for. If it does that would indicate to us that the rally is healthy in the S&P 500 and likely to continue,” he said.
The S&P 500 is less than 3 percent from its record high set in September. It has bounced 22 percent off its late-December low.
