


Bonds have never been riskier than they are right now. I wrote about that yesterday.
Yet investors can’t get enough of them by some measures. That is good news for Congress and the new administration of Joe Biden. To combat COVID-19, Biden is planning to request $1.9 trillion in new spending. He will then almost certainly seek trillions more in spending for other initiatives.
Biden plans to cover his spending the same way other administrations have in recent decades, by borrowing money to make up for shortfalls in revenue. This strategy works as long as investors are willing to buy Treasurys.
The chart below shows the “bid-to-cover” ratio of 30-year Treasury bond auctions. This ratio compares the dollar amount of bids received in a Treasury security auction and the number of bonds the Treasury wants to sell. The bid-to-cover ratio shows how much demand there is for Treasury securities, and a high ratio indicates investors are excited about buying Treasurys.
Bid-to-Cover Ratio Shows High Bond Demand
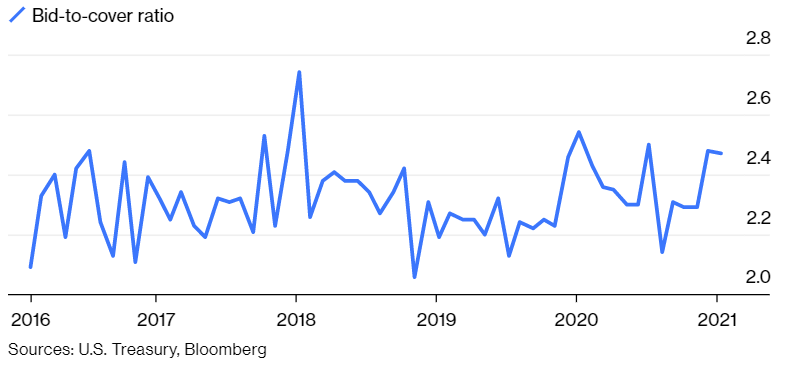

At the most recent auction for 30-year bonds, the government sold $24 billion worth of securities. Investors submitted bids indicating they were willing to buy almost $60 billion worth of bonds, resulting in a bid-to-cover ratio of 2.47, above the 2020 average ratio of 2.36.
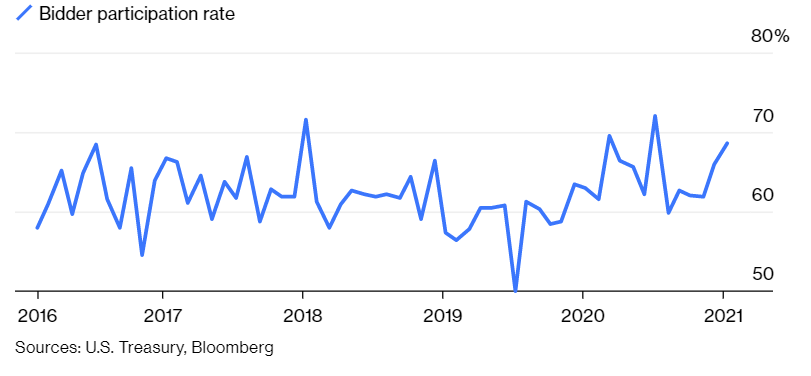
Another important indicator of Treasurys’ demand is the percentage of securities bought by foreign central banks and institutions — shown in the next chart.
Bonds Are Popular Among Foreign Bidders

Treasury Bond Demand Signals Instability
In the most recent auction, foreign bidders bought 68.6% of the bonds offered, above last year’s average of 65.9%.
Robust demand for Treasurys, especially 30-year bonds, is good news for the Biden administration. However, these buyers face large losses if inflation rises and pushes up rates, a definite possibility given some of the administration’s priorities, like a $15 minimum wage.
This is a warning that the most conservative market in the world, Treasury bonds, is irrationally exuberant. Times like these invariably end badly, and this is another indicator that 2021 will be challenging for investors.
Michael Carr is a Chartered Market Technician for Banyan Hill Publishing and the Editor of One Trade, Peak Velocity Trader and Precision Profits. He teaches technical analysis and quantitative technical analysis at the New York Institute of Finance. Mr. Carr is also the former editor of the CMT Association newsletter, Technically Speaking.
Follow him on Twitter @MichaelCarrGuru.