


Every week when I sit down to write this article I try to decide if I should wait until Friday morning or not. I’ve talked about this in the past. Thursday night is the most treacherous day in financial analysis.
And this morning’s massive beat on the monthly Nonfarm Payroll Report put out by the Bureau of Labor Statistics, is a classic example of how thoroughly the perception of reality can change in the space of a few minutes.
According to this week’s release the U.S. economy put on 2.5 million jobs. Continuing unemployment claims, however, rose to 21.5 million. Job gains were broadly based across all sectors of the economy from manufacturing (225,000) to construction (446,000) to education (424,000).
The initial shock of the report created a massive jerk in the markets. Gold was crushed to a new low for the week to the $1680’s. The Dow Jones Industrials opened up more than 700 points while oil continued its rally to fill the gap on the weekly chart as Brent Crude pushed toward $42 per barrel.
President Donald Trump cheered the numbers on as one would expect from him after the couple of months he’s endured.
THESE NUMBERS ARE INCREDIBLE! @MariaBartiromo
— Donald J. Trump (@realDonaldTrump) June 5, 2020
Make no mistake, after more than a week of protests, rioting, looting and cities burning an employment report like this is a welcome sign. But is it the picture of a country on the mend or simply past the worst of a COVID-19 response policy which did far more headline harm than actual harm to the economy?
Trump’s “Greatest Economy Ever” was a mirage that was always going to hit the rocky shores of a credit crisis. Shutting down the economy to fight COVID-19 only amplified a shockwave that was inbound.
Begin to back off the gain on that amplifier, the distortion fades, the signal clears up, and the result should be an improvement in recovery numbers which were artificially suppressed by, in my opinion, ruinous and unnecessary lockdown restrictions.
But, before we get too far ahead of ourselves, let’s not begin to believe this report is anything more than that, a clearing away the over-reactions to COVID-19. And it could easily be mixed with a BLS that is notorious for sugar-coating bad data at politically opportune moments for the sitting administration.
These are statistical tricks (here and here) that have been going on since the Clinton administration and there’s no reason to believe the Trump administration would be any different.
Labor Force Participation cratered at an unprecedented rate in March and April. A small uptick there doesn’t offset, relatively speaking, pittance of new jobs created. This is why the U-3, headline unemployment rate projections of 20% or higher were so far off.
U-3 doesn’t count people no longer looking for work. They aren’t in the workforce. U-6 counts them as well and that number is still 21.8%, a horrific number.
Numbers like this will not simply go away quickly given the size of the shock of March. Add to that the aftershocks of the looting, rioting and outright destruction caused in the past week and we’re not looking at any kind of V-shaped recovery that the markets are currently handicapping.
This is not to say that there will not be a continued rally in U.S. equities, but I take the consistent view that this has more to do with the next wave to hit the international credit markets than the recovery of the U.S. economy.
Europe has a rocky road ahead convincing the “Frugal Four” now “Five” of their proposed bailout package, which begins the process of federalizing the European financial system. Finland’s parliament officially rejected the proposal, but they also made all the right noises about disagreeing in degree rather than philosophically.
Meaning, in the end, there will be a deal which creates a vehicle for the European Commission to dole out money raised through taxes, but the longer it takes for the negotiations of this package to finish up, along with the real possibility of a No-Deal Brexit should keep foreign capital on edge as to where to park in the next few months as things continue to deteriorate in places like Italy, Spain and Portugal.
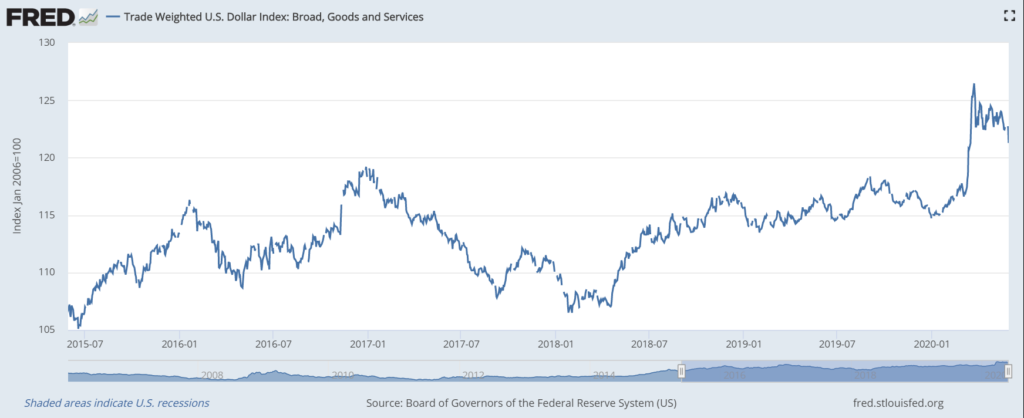
The Federal Reserve, along with the political unrest here at home, has been successful in the short-term in keeping the U.S. dollar from breaking to new highs on the USDX. But the spike higher in the trade-weighted U.S. dollar index in March and April created a spike in the dollar which has now, for the time being, reversed.

With the dollar falling and a reflation trade back on after an extreme deflation trade, rates in the U.S. will keep rising and for now, the yield curve is back to something approximating normal.
So, for now, it looks like the world is trying to get back to normal and the markets are reflecting that as well as the oceans of money the central banks have created.
But I remind you that stocks are trading at multiples to the price of commodities that dwarfs what we saw in 2008. Zerohedge banged on about this all week, how the Nasdaq was trading at a staggering 152 times the Bloomberg Commodity Index.
So something has to give here. Copper has been signaling a recovery rally that is now threatening to become a major spike, oil is gapping higher, nickel is in a new bull wave, as are iron ore prices at Quindao in China, a good leading indicator of what’s happening.
But with the massive supply disruption, mine closures, rig counts falling, wells being taken offline, are we seeing demand pull in these prices or supply push?
If you think it’s the former, bet on that V-shaped recovery that hasn’t happened since the 1920-21 depression of “Do Nothing” Warren Harding, the last one where the government stayed on the sidelines and didn’t do the Keynesian counter-cyclical thing.
But if you’re like me and you think the stimulus money is a mirage, the weaker dollar is a reflection of loosened dollar hoarding and supply constraints are meeting up with the policy of massive monetary inflation, then bet on the much more likely L-shaped recovery that will be easy to mask with the studious application of seasonally adjusted statistics and the ab reactions of algorithmic trading.
• Money & Markets contributor Tom Luongo is the publisher of the Gold Goats ‘n Guns Newsletter. His work also is published at Strategic Culture Foundation, LewRockwell.com, Zerohedge and Russia Insider. A Libertarian adherent to Austrian economics, he applies those lessons to geopolitics, gold and central bank policy.