
On October 15, the retail industry threw itself a party.
The National Retail Federation (NRF), the industry’s biggest trade group, predicted shoppers will spend $1.013 trillion this November and December. That’s up 4.2% from last year.
If it happens, it’ll be the first holiday season ever to top $1 trillion, and it’d mark the fastest growth since 2021.
NRF’s CEO called American shoppers the “unsung heroes” of the economy.
The headlines ran with it. Record holiday. Resilient consumer.
But the people who actually build the earnings forecasts for retailers, restaurants and carmakers did something else.
They started cutting.
Not this year’s numbers. Next year’s.
The Second Column
Every week, I track how analysts change their earnings forecasts across every sector of the market.
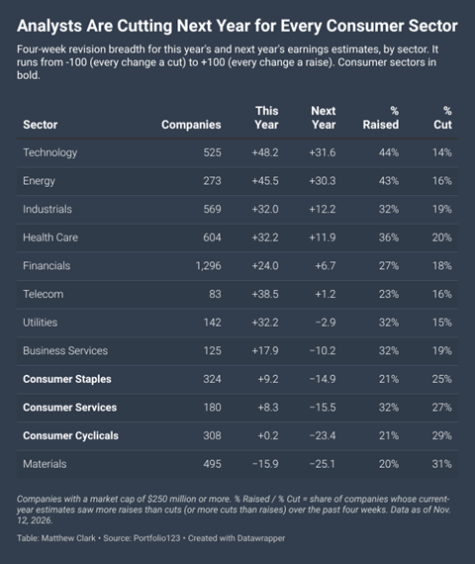
I count every raise and every cut over the past four weeks. Then I split them two ways: changes to this year’s estimates and changes to next year’s.
I call it revision breadth. It runs from -100, where every change was a cut, to +100, where every change was a raise. Anything above zero means more raises than cuts. Anything below zero means more cuts. Here’s where it gets interesting. Look at the bottom of that table.
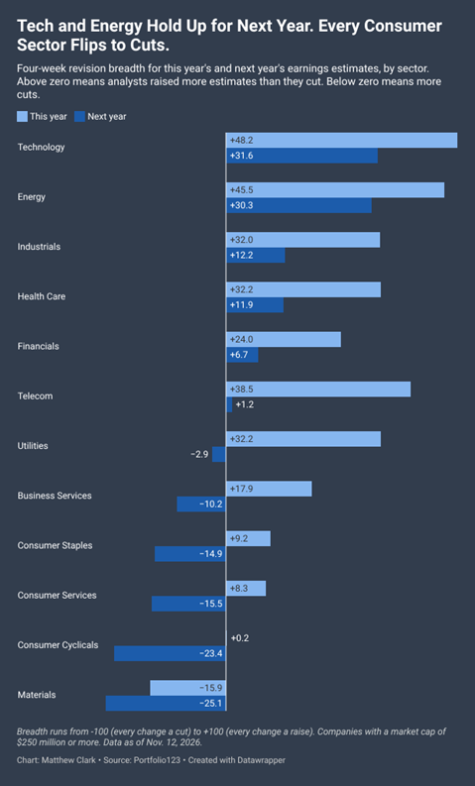
Consumer cyclicals, the carmakers, homebuilders and clothing chains, sit at +0.2 for this year. Dead flat. For next year, they’re at -23. Even on this year’s numbers, more companies in the sector are getting cut than raised: 29% against 21%.
Consumer staples, the grocers, big-box stores and household brands, go from +9 this year to -15 next year.
Consumer services, the restaurants, hotels and media names, go from +8 to -16.
That’s three consumer sectors. All three flip from raises this year to cuts next year.
Now look at the top of the table.
Technology sits at +48 for this year and +32 for next year. Energy sits at +45 and +30. Analysts raised both years, and by a wide margin.
In tech, 44% of companies saw more raises than cuts to this year’s estimates. Only 14% saw the reverse.
Analysts are forecasting the money into data centers and oilfields, and out of the shopping cart.
The Fine Print On A $1 Trillion Holiday
If shoppers are such heroes, why would analysts cut next year?
Read NRF’s own forecast closely. The answer is in there.
First, the number isn’t adjusted for inflation. Part of that 4.2% growth is just higher prices on the same stuff. NRF expects core goods prices to rise 2.5% this year, up from 1.6% in 2025.
Second, the spending is lopsided. NRF says higher food and gas prices will squeeze middle- and lower-income shoppers, while wealthy households carry the season. In some categories, the top 10% of shoppers account for up to 70% of sales.
Third, the mood is grim. The University of Michigan’s consumer sentiment index rose to 51 in early November. That’s a three-month high. It’s also nowhere close to the long-run average of 84.5. Back in May, it hit an all-time low.
A record holiday driven by price hikes and the top 10% isn’t a strong consumer. It’s a stretched one. Analysts can see it in their models for 2027.
Here’s the lesson. This year’s revisions grade a year that’s almost over. Next year’s revisions indicate where analysts think earnings are headed.
So read the second column.
Adam’s System Got There First
Here’s what made me sit up.
Every week, Adam’s Green Zone Power Ratings system flags companies primed to beat their earnings estimates and companies primed to disappoint. It doesn’t look at sectors. It looks at one stock at a time.
Look at this week’s bearish list.
Target Corp. (TGT). Lowe’s Companies Inc. (LOW). The Home Depot Inc. (HD). Ross Stores Inc. (ROST). Williams-Sonoma Inc. (WSM). Gap Inc. (GAP). Bath & Body Works Inc. (BBWI). Walmart Inc. (WMT). BJ’s Wholesale Club Holdings (BJ).
That’s nine retailers out of 10.
Now look at the bullish list.
Cybersecurity. Tax software. Test equipment. Data software. The contractors who lay fiber to data centers. Only two of the 10, an airline and a sporting-goods maker, lean on the shopper.
Two different methods. Same answer. Lean toward the businesses analysts are still raising. Be careful with the shopper.
“Bullish” Earnings to Watch
These stocks are expected to beat their earnings per share (EPS) from the previous quarter. And if those expectations are met or exceeded, they could potentially trade higher.
For this screen, stocks must meet four criteria:
- 10 or more analysts cover the stock.
- The average analyst recommendation is a “Buy.”
- It BEAT analysts’ EPS estimates for the previous quarter.
- The average analyst estimate for the current quarter’s EPS is greater than the previous one.
Here are the 10 companies that made this week’s list:
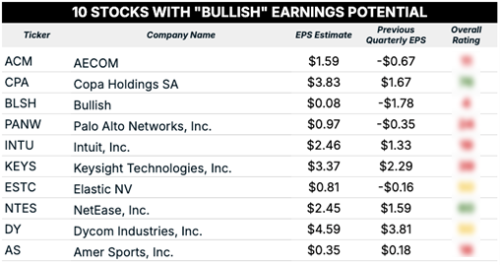
Keysight Technologies Inc. (KEYS) reports Thursday, November 19, after the close. The estimate is $3.37 a share, up from $2.29 last quarter.
First, a fair warning. That $2.29 is close to Keysight’s GAAP number. On an adjusted basis, it earned $3.07 last quarter. So the jump Wall Street expects is closer to 10% than 47%.
That’s a bar Keysight can clear.
Now look at how it handled the last bar. Analysts expected $2.48 a share. Keysight delivered $3.07. That’s a 24% beat. Sales rose 37% to $1.85 billion. And orders topped $2 billion for the second straight record quarter.
Management then guided this quarter to $3.34 to $3.40 a share. The estimate sits right in the middle.
Keysight sits in tech, the sector at the top of my table. What does it do? It makes test gear. Before a chip, a cable or a 1.6-terabit optical part ships into an AI data center, somebody has to prove it works.
Keysight sells the equipment that does the proving. Every faster generation of networking gear needs new test gear.
And demand hasn’t cooled. On November 2, Keysight named a new finance chief. In the same release, it said demand across its markets “remains strong.”
Yet the stock trades around $306. That’s about 22% below its 52-week high of $389.93. It sells for about 22 times expected earnings over the next year. After the last blowout, the stock fell 6% the next day.
Now the caveat. Keysight told investors that parts shortages will limit how fast it can turn orders into sales. And one-time tariff effects helped this year’s profits.
But here’s why Thursday matters. Keysight will give its first guidance for fiscal 2027. Management already said it heads into next year from a “strong” starting position. That’s the second column, filled in live.
“Bearish” Earnings to Watch
For our “bearish” earnings screen, we’re only looking for two things:
- 10 or more analysts must cover the stock.
- The average analyst estimate for the current quarter’s EPS is less than the previous quarter’s.
We want companies that are covered by a sufficiently large group of Wall Street analysts who collectively expect the company to report a quarter-over-quarter (QOQ) decline in earnings.
Here are 10 companies that passed this screen:
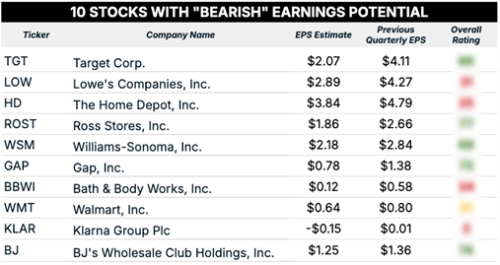
The Home Depot Inc. (HD) reports Tuesday, November 17, before the open. The estimate is $3.84 a share, down from $4.79 last quarter.
Of all nine retailers on the list, Home Depot shows the gap between price and reality most clearly.
That drop is mostly the calendar.
Summer is Home Depot’s big season, so the fall quarter always comes in smaller. The better comparison is a year ago, when it earned $3.74 on an adjusted basis.
So Wall Street wants growth. About 3% of it.
Last year, Home Depot missed this same quarter. It blamed a quiet storm season.
This year, the stock has run hard into the report. Home Depot closed at $282.85 on October 2. It now trades around $350. That’s a 24% climb in about six weeks. Rival Lowe’s climbed nearly 20% from early October to early November.
The reason is rates. Mortgage rates fell three weeks in a row, to 7.18%. Investors are betting the housing freeze is ending.
But look at what the housing numbers say.
A year ago, mortgage rates sat at 6.22%. Today, they’re nearly a full point higher. The Fed raised rates in September. Pending home sales fell 10.5% from a year ago in October. That’s the steepest drop in three years.
Home Depot’s own numbers tell the same story. Last quarter, sales at existing stores rose 1.7%. But the number of transactions fell 1%. Fewer customers paid more per trip. Its own finance chief called the housing market “frozen.”
And Home Depot didn’t raise its full-year guidance. It held it, and that guidance leans on one-time tariff refunds to cover higher fuel and energy costs.
Lowe’s, also on this week’s bearish list, already guided its quarter to adjusted earnings about 7% below a year ago.
To be fair, Home Depot has real strengths. Its business with contractors keeps growing. Online sales rose 11% last quarter.
But a stock up 24% in six weeks is priced for a thaw. The housing data says we’re still in winter.
What To Do Next Week
Here’s your plan.
If you own Home Depot, don’t add before Tuesday morning. Skip the headline earnings number. Go straight to transactions and the full-year outlook. If transactions fall again and guidance only holds thanks to tariff refunds, the rally will have gotten ahead of the business.
If you’re watching Keysight, Thursday night is your moment. Check orders first. If they top $2 billion again, look at the first-quarter guidance for fiscal 2027. Growth there is the setup the system wants.
And do one thing with your portfolio this weekend. Sort what you own by sector. If you hold consumer names that report next week, don’t add before they do. If you’re putting new money to work, start with the sectors where analysts are still raising next year: tech, energy, industrials and health care.
Keep both tables handy. The rest of the names report all week long.
The retail industry is planning a party. The analysts already went home.
Until next time…
Safe trading,

Matt Clark, CMSA®
Chief Research Analyst, What My System Says Today
P.S. The last time America stood at a point like this was the summer of 2000. Over the next two years, stocks lost nearly half their value.
Now, Money & Markets chief investment strategist Adam O’Dell, Strategic Fortunes chief strategist Ian King and Grey Swan founder Addison Wiggin say we’ve crossed that line again, and November 16 could be the point of no return.
What comes next could be bigger than the dot-com bust, the 2008 meltdown and the 2020 collapse combined. But every major shift creates winners as well as losers.
That’s why these three have teamed up for a new service called The Alliance. They’ve built a 12-position Final Reckoning Portfolio designed for whatever happens next in the markets.
You’ll also receive weekly portfolio updates, alerts and new investment ideas from all three of them. Click here to get the full details.