

Remember the gym?
Five weeks ago, we took you to a fourth-quarter basketball game. Your team was up six. One kid had scored 31 of the team’s 48 points. Nobody else could hit a shot.
The scoreboard said the team was fine. The floor said the team was gone.
So we told you to stop watching the scoreboard and watch the floor.
Here is what happened next. The bench came alive. Kids who hadn’t scored since halftime started hitting shots. And the star? He went cold.
But that’s not the part that matters.
What matters is that the bookies moved the line.
The Two Numbers I Said to Watch
On September 23, I walked you through my MC01 Risk Regime panel.
Five gauges, one question: calm or rough?
Four gauges said calm. One said the average stock had quit.
Then I gave you two tripwires. If the high-yield spread pushed through 3.00 and stayed there, the lenders had changed their minds. If the VIX closed above 20 for a full week, so had everyone else.
I told you either one would turn a narrowing market into a breaking one. And that is when you act on the index itself.
Here is the scorecard.
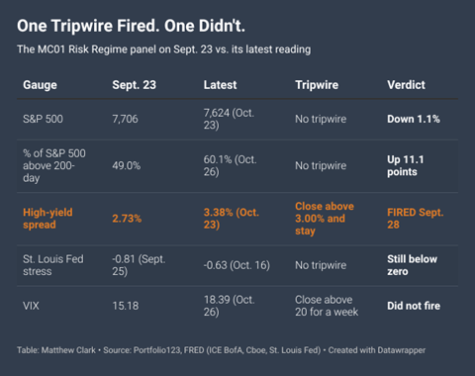
The VIX never fired. Its highest close since September 23 was 19.99 on October 16. That is close. It is not 20, and it never came near a full week.
The credit tripwire fired three trading days later.
The Lenders Flinched First
The high-yield spread is the extra yield investors demand to lend to companies with weak credit. On September 23, it sat at 2.73.
On September 28, it closed at 3.02. It has not closed below 3.00 since. That is 20 straight sessions. Last Friday, it sat at 3.38.
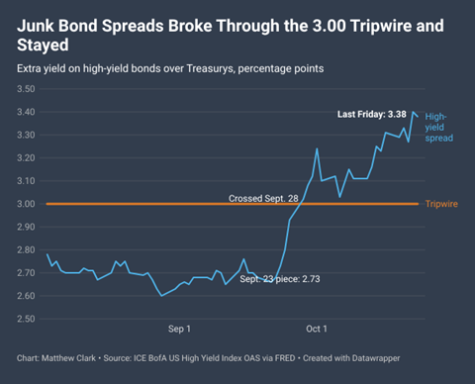
A 65-basis-point jump in a month doesn’t sound like much. A spread of 3.38 is still low by long-run standards.
So why do we care?
Because of where the stress is showing up.
Split the junk market in two.
On one side, BB bonds. These are the best of the weak borrowers. On the other side, CCC bonds. These are the companies that might not make the next payment.
In mid-August, CCC borrowers paid about 8.4 percentage points more than BB borrowers. Last Friday, they paid 11.3. That gap has widened eight weeks in a row.
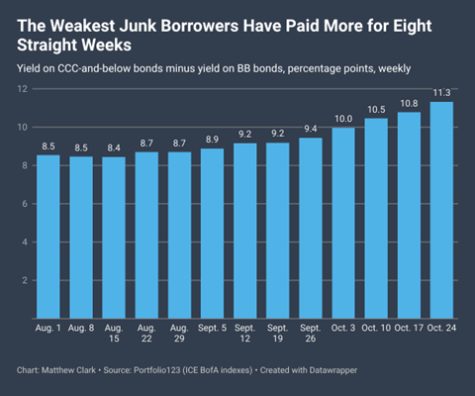
That is the bookies moving the line. Not on the whole league. On the worst teams in it.
Bond investors get paid to be pessimists.
They are telling you the shakiest companies in America just got more expensive to keep alive.
Meanwhile, the Floor Came Back
Now look at the stock market. It went the other way.
On September 23, 49% of S&P 500 Index stocks traded above their own 200-day average. A week later, it hit 41.6%. Thin got thinner, just like I warned.
Then it turned.
As of Monday, 60.1% of the index sits above its long-term trend line. That’s roughly 90 companies climbing back above the line in four weeks.
And the index? It barely moved. The S&P 500 finished last Friday about 1% below its level on September 23.
That is the narrowing in reverse.
The equal-weight S&P 500, where every company counts the same, beat the regular index by 4.6% from its October low. Last Thursday, the index fell 1.2% while 335 of its stocks closed higher.
The bench is scoring. The star is the one in trouble.
But don’t call it a comeback yet.
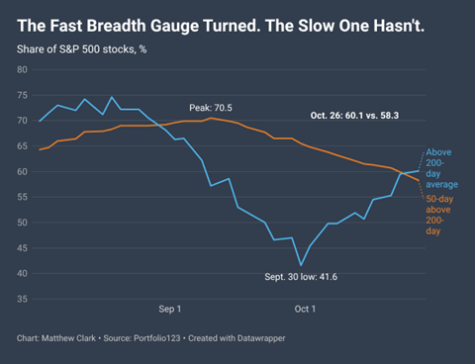
The orange line on that chart is a slower read.
It counts stocks whose 50-day average sits above their 200-day average. That line peaked at 70.5% on September 10. It has fallen every week since and sits at 58.3% today.
A bounce in the fast gauge is a rally. A turn in the slow gauge is a trend. We have a rally.
What the Panel Pointed To… and How It Did
Five weeks ago, I told you where to put new money. In a thin tape, I said the two factors that earn their keep are Quality and Volatility. Momentum and Growth get expensive.
Here is how those calls scored from September 19 through last Friday.
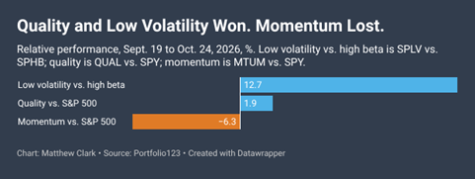
Quality beat the market by 1.9%. Low-volatility stocks beat high-beta stocks by 12.7%. Momentum trailed the market by 6.3%.
We got that one right. I’ll take it.
One honest note: for the first two weeks, momentum and high-beta ran away from us. If you checked on October 3, the advice looked wrong. It took patience.
What to Do About It
I set the line at 3.00. The spread crossed it and stayed there. I am not going to move the line after the fact.
So here is the plan. And I will not hedge it.
Stop adding new money to the index. The tripwire said act on the index. No new dollars into S&P 500 funds until the high-yield spread closes back below 3.00 and the golden-cross line turns up. Two conditions, both visible on the charts above.
You don’t have to sell what you own. Breadth is improving, and stress is still low. The St. Louis Fed’s stress reading sits below zero. This is a warning, not a fire.
Keep new money where the panel pointed. Quality and low volatility. Real cash flow, real returns on capital, manageable debt and stocks that don’t swing hardest when buyers disappear.
Check the balance sheets you own. The stress is starting at the bottom of the credit ladder. Any company that needs to borrow to stay alive just watched its price go up. If you own one, now is the time to decide if you want to keep it.
The Fed speaks at 2 p.m. today. Microsoft (MSFT) and Alphabet (GOOGL) report tonight. Plenty could change this week.
But the line already moved.
Watch the bookies.
Until next time…
Safe trading,
Matt Clark, CMSA®
Chief Research Analyst, What My System Says Today