Right now, the S&P 500 is in the midst of its biggest three-month gain since 1957. Many analysts use the S&P 500 as a benchmark to describe the stock market. Their data often goes back to 1957 because that’s when Standard & Poor’s expanded the index to 500 companies and their stocks.
History says the worst case is a horrendous 90% decline. The best case is a 30% gain followed by a bear market.
This ignores the fact that there was a stock market before 1957. Analysts using 1957 as their starting point argue markets before then were different than modern markets. These earlier markets, including the market crash leading into the Great Depression, were so different they can be ignored.
At times like this, that argument seems ridiculous. Human nature has been the same for thousands of years. Greed and fear have always been important motivations. After all, ancient civilizations went to war because of greed and fear.
Those emotions explain stock market prices since at least since 1636, when traders in Holland created a bubble in tulips.
Right now, greed is driving many traders and that explains why the S&P 500 is experiencing its best three-month rally in more than 70 years. Looking back 90 years we see a market that looks a lot like the current stock market.
The Great Depression vs. 2020’s Stock Market Rally
Using data from the Great Depression, we see that there were many short-term rallies like the current one.
The Dow Jones Industrial Average covers that period. The chart below shows there were about nine moves like this from 1928 to 1938. They are marked with vertical blue bars.
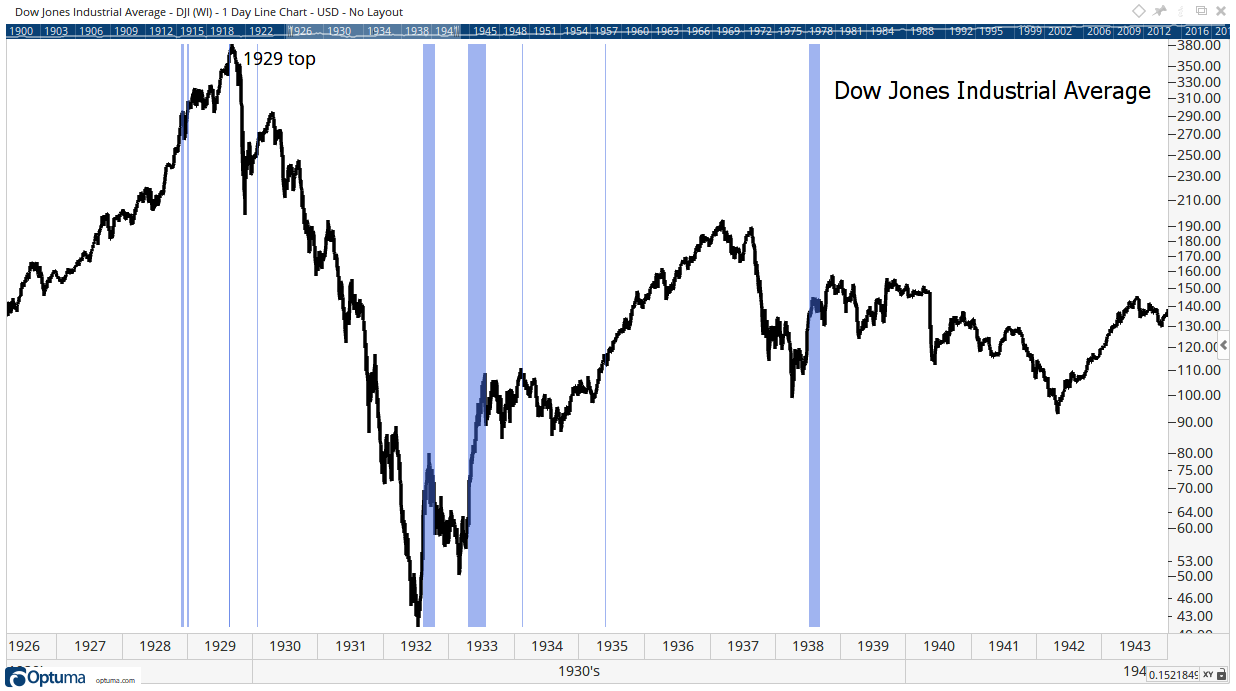
Source: Optuma
This chart can help us interpret the current market. Rapid gains were never promising for the long-term investor amid the Great Depression. In 1928, the index gained another 33% after the signal. But it fell more than 90% after that.
Large three-month rallies were followed by either declines or sideways action in the stock market.
Recent gains are a warning sign for prudent investors.
History says the worst case is a horrendous 90% decline. The best case is a 30% gain followed by a bear market.
There could be more gains ahead but there’s likely to be a chance to buy after a decline.
• Michael Carr is a Chartered Market Technician for Banyan Hill Publishing and the Editor of One Trade, Peak Velocity Trader and Precision Profits. He teaches technical analysis and quantitative technical analysis at New York Institute of Finance. Mr. Carr also is the former editor of the CMT Association newsletter Technically Speaking.
Follow him on Twitter @MichaelCarrGuru.