When the wave breaks here. Don’t be there. Or you’re gonna get drilled! — Turtle
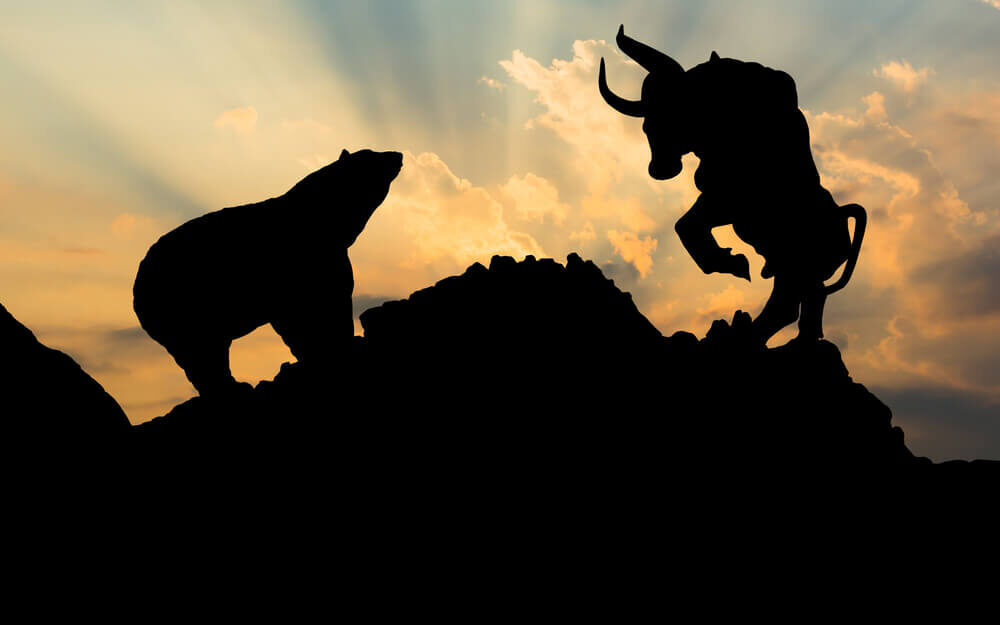
A New Bull Market?
Have U.S. stocks really entered a new bull market?
That’s the claim of some experts following the S&P 500’s recent attainment of a 20% increase from its October 2022 interim low. We have some reservations.
Of note, the S&P 500 is still down over 7% from its all-time closing high reached on December 29, 2021. Certainly, the S&P 500 could hit a new high as part of this rally. But it would be short-lived.
There are a number of factors at play that are bearish for the stock market. Interest rates, Treasury sales, credit market stresses and an imminent recession.
In fact, we believe the S&P 500 has become increasingly risky over the last six months as the top technology stocks have bubbled up. Because of this, the portfolios of many investors are now unknowingly in the impact zone. And they will get absolutely drilled when the market resumes its next bear market leg down.
We’ll get to the how and why of this in just a moment. But first, some context is in order.
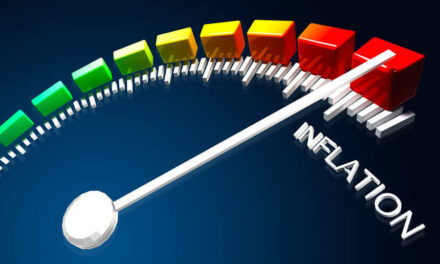
This week’s Bureau of Labor Statistics Consumer Price Index (CPI) report is as good a place as any to look at first. As you may have seen, the BLS reported that consumer price inflation, as measured by the CPI, increased at an annual rate of 4% in May. That’s more than double the Federal Reserve’s arbitrary 2% inflation target.
The gap between consumer price inflation and the Fed’s inflation target remains the focus of Fed monetary policy. This week delivered some eventful news in this regard…
Birth of the Hawkish Rate Pause
Since March 2022, the Fed had increased the federal funds rate 10 consecutive times — from near zero to a range of 5% to 5.25%. The intent of this series of rate hikes was to suppress the raging consumer price inflation of the Fed’s own making.
This week, however, the Fed paused. Following the federal open market committee meeting, the Fed stated it would not be hiking rates nor cutting rates.
But with consumer price inflation still at double its arbitrary 2% inflation target, the Fed needed to sound hawkish. Thus, the Fed birthed something called the hawkish rate pause.
That is, rates were paused, with verbal threats backed by dot plots showing additional rate hikes coming later this year. In fact, according to the latest plot of dots, most Fed officials are projecting the federal funds rate will peak at a target range of 5.5% to 5.75%. That’s 50 basis points higher than where it currently stands.
Relatively higher interest rates present challenges for debt-reliant industries, such as residential and commercial real estate. This week, for example, owners of the Westfield San Francisco Centre mall defaulted on $558 million in outstanding mortgage debt. This came shortly after the owner of the Hilton, Parc 55 defaulted on a $725 million non-recourse loan. And with defaults rising, this puts the banking sector at risk.
In reality, the Fed wants to be done hiking rates. Credit markets are stressed. The banking crisis from several months ago isn’t over. This brief reprieve of additional bank failures is merely the calm before the storm.
In the interim, perhaps the rate pause will help buy the banks a little time. And, at the same time, maybe a cooling economy will do the work of lowering the CPI for the Fed.
Recession Watch
As for the stock market’s massive bear market rally, will hawkish threats from the Fed be enough to return investors to their senses?
We doubt it. On Thursday, the S&P 500 increased 53 points and the Nasdaq jumped 156 points. Investors may be calling the Fed’s bluff on its silly hawkish rate pause.
Greedy investors are a mindless bunch. They’ll push a rally to the extreme time and time again, even if there’s no logical fundamental basis for it. Ultimately, this makes the subsequent crash increasingly destructive.
David Rosenberg, former chief economist at Merrill Lynch and president of Rosenberg Research, recently warned that the stock market’s rally is unfounded, and that the U.S. economy is sinking into a recession. Per Rosenberg:
You can believe the press headlines or you can believe the leading indicators — which suggest that we do indeed have a 99.15% chance of an official [National Bureau of Economic Research] NBER-defined recession. And if that is the case, then it is the first time in recorded history that a fundamental bear market ended before the downturn even arrived.
Rosenberg’s noted percent chance of a recession is suspiciously precise. But coming from him, someone who understands economic cycles better than just about anyone, we’ll take it for what it implies. That a forthcoming recession is highly likely.
By this, the stock market is soaring in the face of an imminent recession. And irrationally exuberant investors are setting themselves up for massive losses.
For example, stocks, as represented by the S&P 500, are extremely expensive. The cyclically adjusted price to earnings (CAPE) ratio is above 30. This puts today’s CAPE ratio above what was reached at the 1929 stock market peak, just before the crash and onset of the Great Depression.
Are You Unknowingly in the Impact Zone?
Remember, a pause in rate hikes is not necessarily bullish for stocks. That was the experience following the Fed taking the federal funds rate to 5.25% on June 29, 2006, which was the last rate hike of its mid-2000s rate hiking cycle.
If you recall, the Fed then paused and held the federal funds rate at 5.25% for roughly 15 months. Then, on September 18, 2007, the Fed cut rates 50 basis points. And by December 2008, the Fed had gone full ZIRP … slashing the federal funds rate to zero.
Did this prevent stocks from crashing?
The S&P 500 peaked out at about 1,586 in October 2007. It then slowly slid down to about 1,200 in August 2008. By September 2008, the S&P 500 was in complete freefall. Crashing to a bottom of 666 on March 6, 2009. This amounted to a top to bottom decline of 58%.
Who knows if such a dramatic crash is in store today. But what we do know is that the stock market, as measured by the S&P 500, is extremely risky at the moment. Moreover, many investors are not recognizing what has taken place and why this has put their portfolio in the impact zone.
The S&P 500, which is weighted by market capitalization, has become heavily concentrated. Apple, Microsoft, Amazon and Nvidia make up roughly 20% of the index’s market value. This type of extreme concentration occurred during the dot-com bubble.
Investors who hold an S&P 500 index fund for its implied diversification are now extremely exposed to four high-priced speculative technology stocks.
They may be thrilled about the indexes year-to-date returns of over 15%. But what many of these S&P 500 index investors don’t recognize is that these gains have come at the expense of more and more risk.
They may think they’re well diversified across a broad index of stocks. In truth, 20% of their portfolio now sits in four technology bubble stocks.
Hence, when the rally breaks, and the market falls, they’ll find themselves squarely in the impact zone. Are you unknowingly in the impact zone too?
[Editor’s note: Like this article? If so, please Subscribe to the Economic Prism.]


