Interest rates are rising. We all know that. Analysts and traders are speculating about how high rates can go.
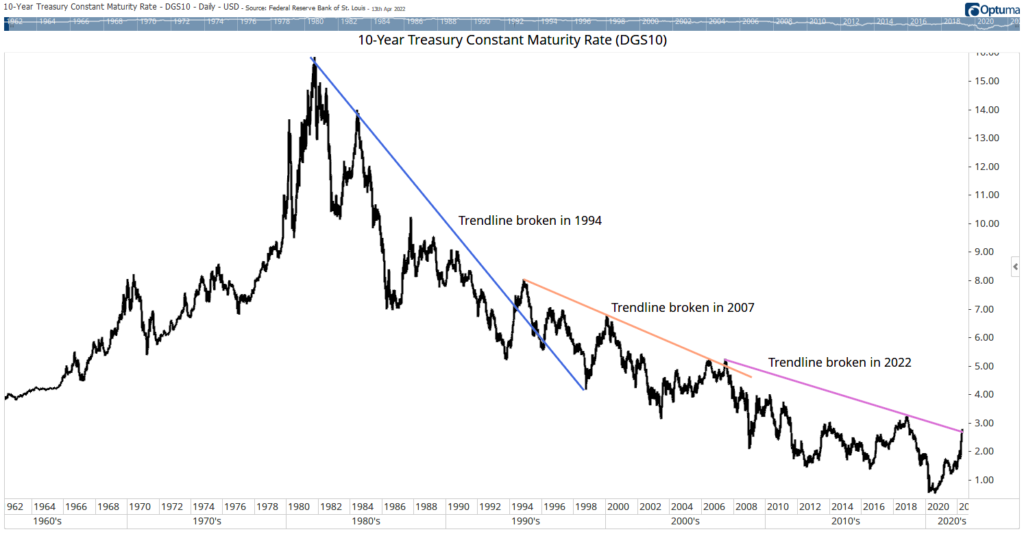
While developing my forecast, I noticed something interesting (and ominous) on the chart below.
This chart shows the rate on 10-year Treasury notes. The high was 15% in September 1981. Since then, the trend has generally been down. Of course, no trend moves in one direction. There are short, countertrend moves, and these rallies in the 40-year downtrend are associated with dramatic events.
Treasury Bonds’ Downward Interest Trend

Source: Optuma.
Bond Trends Indicate a New Financial Crisis
To identify reversals in the trend, I added simple trendlines to the chart. Line breaks highlight significant rallies that interrupted the trend. When the line broke on the chart, I drew a new line from that point.
The first break came in 1994 — when Orange County, an area near Los Angeles, filed for bankruptcy. The county treasurer had made big bets on interest rates and lost. The strategy had worked for some time. And investment gains funded government services.
When the market turned against the county, taxpayers learned officials borrowed $12 billion to increase the returns on their $8 billion fund. They faced a $1.5 billion loss. This 19% loss led to significant problems.
The next trendline broke in 2007. That was when two large hedge funds run by Bear Stearns shut down after steep losses. Before their collapse, the funds held more than $20 billion worth of mortgage-backed securities (mostly subprime mortgages). When the market turned against these bets, these hedge funds were the first casualty of the global financial crisis, leading to a 50% drop in the stock market by 2009.
From there, I drew a third trendline. And 2022 just broke that line.
This break marks the end of a downtrend that began before most Americans were born. Based on history, it’s also likely we see a financial crisis soon.
Click here to join True Options Masters.


