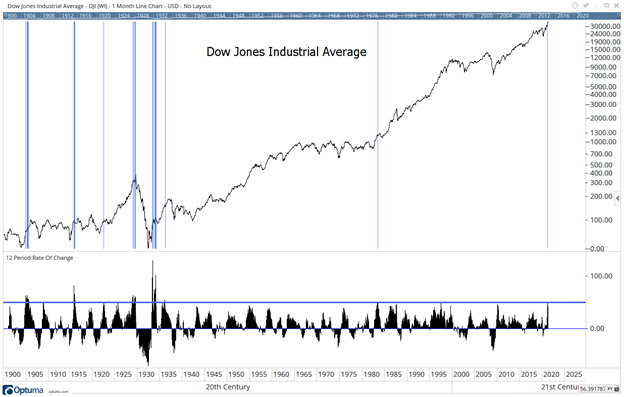
Over the past year, major stock market averages made large moves in the bull market. The Dow Jones Industrial Average is more than 80% above its March 2020 low. In the past 12 months, the Dow is up about 50%.
A move of that size is not unprecedented, but it is rare. This is the twenty-second time since 1900 the Dow has gained at least 50% in 12 months. These events are marked by blue lines in the chart below. There tend to be clusters of signals and nine general times when rallies of this size occurred.
Dow’s Bull Market Performance Mirrors History

Source: Optuma.
Bull Markets of This Type Elevate Risks
Gains of this type have been rare since the Great Depression. There is just one occurrence in May 1983 since 1936.
Because of the rarity of these events, it’s difficult to determine whether or not it provides information about what the future holds.
In general terms, we saw gains like this after several bear markets. These rallies include the beginning of bull markets that followed the Panic of 1901, after the stock market reopened following its closure for the start of World War I, after the deep recession that began in 1920 and after deep drawdowns during the Great Depression.
Sharp gains also occurred in late 1928 as the stock market bubble pushed towards its high in 1929.
The signal in 1983 followed a 16-year trading range. The Dow first reached 1,000 in January 1966. After several bear markets, the Dow finally moved decisively above 1,000 in December 1983. Because it followed a bear market, it’s similar to the signals after bear markets.
Back testing provides mixed results, but there is an elevated risk of a 10% decline in the next 12 months. In fact, there is a better than 50% probability that there will be a pullback of that size in the next six months. Using a random entry, the probability of a 10% decline within six months is less than 30%.
History tells us that after a large gain, the bull market is likely to pause. The only time it didn’t was in 1928, and that rally ended very badly.
I’ve told people anyone could do this and double their money in a year.
By the end of 2020, I proved it.
An equal weighted account using this strategy went up 132% last year.
Imagine turning every $2,000 into almost five grand.
Click here to see how I do it.
P.S. I wasn’t surprised considering my 12 year back test never had a losing year. But our live results are proving to be better. Click here to see how this could benefit you.
Michael Carr is a Chartered Market Technician for Banyan Hill Publishing and the Editor of One Trade, Peak Velocity Trader and Precision Profits. He teaches technical analysis and quantitative technical analysis at the New York Institute of Finance. Mr. Carr is also the former editor of the CMT Association newsletter, Technically Speaking.
Follow him on Twitter @MichaelCarrGuru.


