
We’re in the early stages of a bull market. This might surprise many investors … and their surprise is, in fact, evidence of the bull.
We often say that bull markets climb a wall of worry. There’s a lot to be concerned about: inflation, interest rates, home prices, unemployment and slow wage growth are just the start.
Looking beyond the U.S., the list of worries grows to include wars in Ukraine and Israel, coups in Africa that threaten to unleash an immigration crisis in Europe, aggressive positioning from China and more. Again, this isn’t an exhaustive list.
Altogether, that’s a daunting wall of worry this bull has to climb.
But worries alone, of course, don’t lay the groundwork for a bull market. We also need a strong economy, good earnings and reasonable valuations in the stock market.
And that might be just what we’ve got…
Why the Bull Market Has Room to Run
Beneath the surface, the economy is robust. Job growth remains strong. Inflation is lower than it was two years ago and falling. This isn’t obvious from the headlines, which are a source of worry for the bull.
Interest rates are another concern that seems contained. The Federal Reserve might be done raising rates. While rates may not fall, it seems like they’re done going up. This will make stocks more attractive.
Valuation depends on earnings. Earnings for the companies in the S&P 500 Index are likely to report year-over-year growth this quarter. That will end a three-quarter earnings recession that featured year-over-year declines. With earnings growing again, stocks are more attractive.
International worries aren’t going away soon, either. But even here in the States, these headlines are, in a way, bullish for stocks. The U.S. is a safe haven in times of crisis. As dollars flow into the U.S., investors will buy bonds (pushing interest rates down) and stocks (pushing prices up).
The biggest factor supporting higher stock prices is simply the age of the bull. This bull market began in October 2022, a year ago. On average, bull markets last over two years.
As you can see in the following long-term chart, stocks suffered two bear markets since the beginning of 2020.
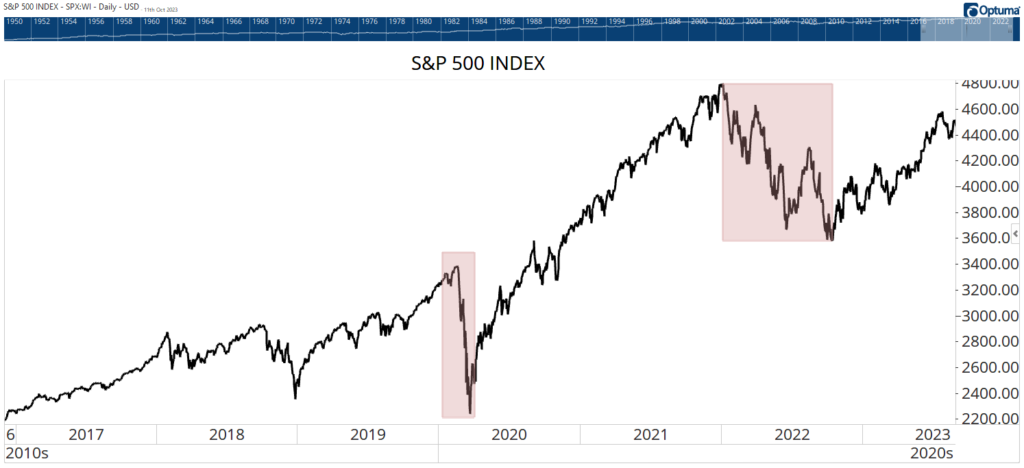
The massive run-up between the two bears lasted about 21 months, near the average length of a bull.
The chart above shows that the S&P 500 is near its all-time high. In the past, price moves accelerated to the upside after reaching new highs. As old traders say, there’s nothing more bullish than a new high.
This young bull should run for another year, and the fastest part of the rally appears ready to begin.
Until next time,

Mike Carr
Chief Market Technician