Editor’s Note: Have you missed any of Mike Carr’s charts in Money & Markets Daily? We’ve got you covered. Monday to Friday, Mike highlights a chart that catches his eye — and what it could mean for markets or the economy going forward. Check out his analysis from the last week below.
Traders’ Message to the Fed: Keep Worrying
Federal Reserve officials meet this week to consider whether it’s time to cut interest rates.
Earlier this month, Fed Chair Jerome Powell told Congress: “We are waiting to become more confident that inflation is moving sustainably down to 2%. When we do get that confidence, and we’re not far from it, it will be appropriate to begin to dial back the level of restriction so that we don’t drive the economy into recession.”
Bond traders aren’t expecting inflation to fall soon. The chart below shows the five-year breakeven inflation rate, revealing what traders expect inflation to average over the next five years.
The trend has been up this year, an indicator that traders believe inflation is more likely to rise than fall. This is bad news for those expecting a rate cut.
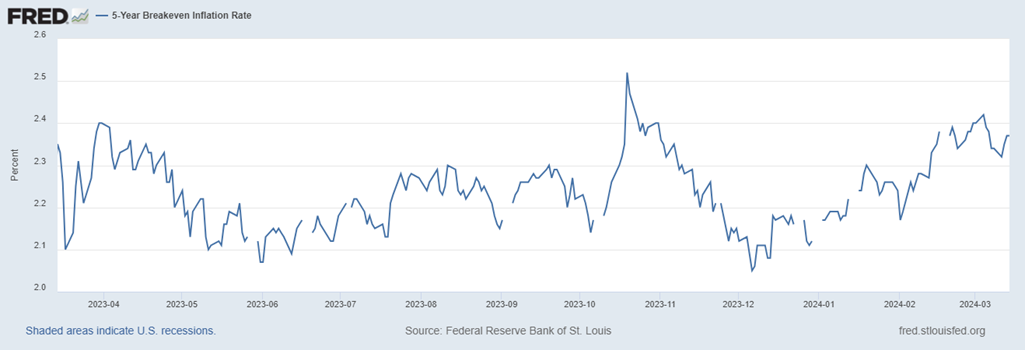
Source: Federal Reserve.
Rates Are Just Right for Now
Interest rates follow the pattern of a children’s story we all remember. In The Three Little Bears, Goldilocks found the porridge to be too hot, too cold, or just right. After decades of being too cold, interest rates are just right according to a quantitative rule.
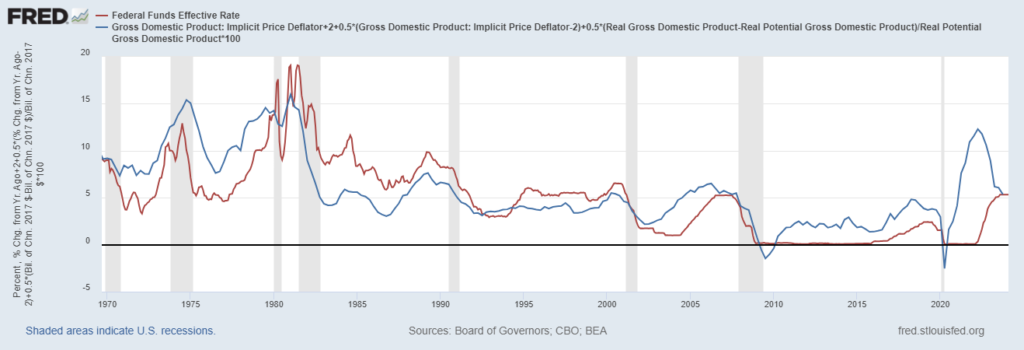
The Taylor Rule uses the difference between what the economy is producing with its potential output with inflation to define the “just right” level of interest rates. The chart below shows that for the first time this century, the Fed Funds rate is equal to the Taylor Rule rate.
The chart also shows Fed Funds rate (the red line) should be too hot — or above the Taylor Rule rate — to fight inflation, as we saw in the 1980s. This indicates that the Fed is likely to cut slowly, and we should see that when the dot plot is released tomorrow.
Fed Funds Rate Should Be Above Taylor Rule Rate to Fight Inflation
Source: Federal Reserve.
Fed May Raise Rates This Year
Yesterday, we saw that the Federal Reserve has gotten interest rates just right for the first time in decades. But rates need to be higher to win the battle against inflation. Today’s chart shows that while everyone seems to believe the Fed will cut interest rates this year, it may actually raise rates again soon.
Fed Chair Jerome Powell has noted that the central “does not expect that it will be appropriate to reduce the target range until it has gained greater confidence that inflation is moving sustainably toward 2%.”
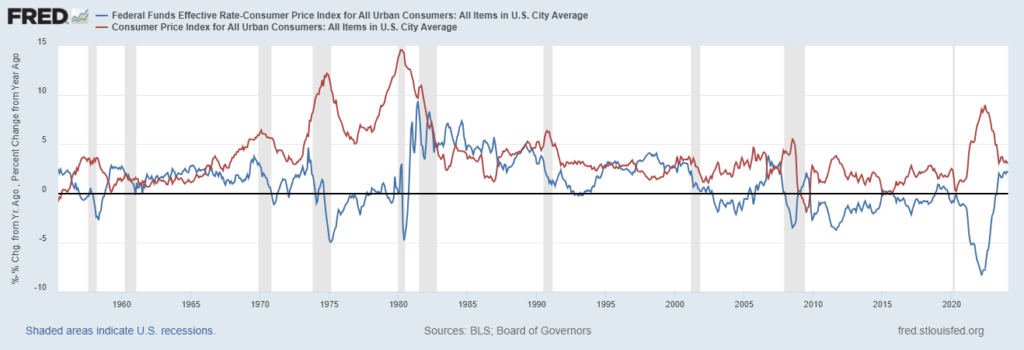
The chart below shows why. Inflation (the red line) spikes when interest rates adjusted for inflation (the blue line) are too low. The Fed has kept rates low since 2010. Rates went too low in 2022 and inflation spiked. Cutting rates too soon will push the blue line back below zero.
The Fed is likely to hold rates steady. However, if inflation moves back above 4% (it’s at 3.2% now) the next move in rates will be up rather than down. That will crash the stock market, and it isn’t something the Fed wants to do. Even so, inflation could force its hand. Expect Powell to mention this later today at his press conference.
Tracking Inflation & Interest Rates
Source: Federal Reserve.
Used Car Prices Show Even Disinflation Doesn’t Bring Good News
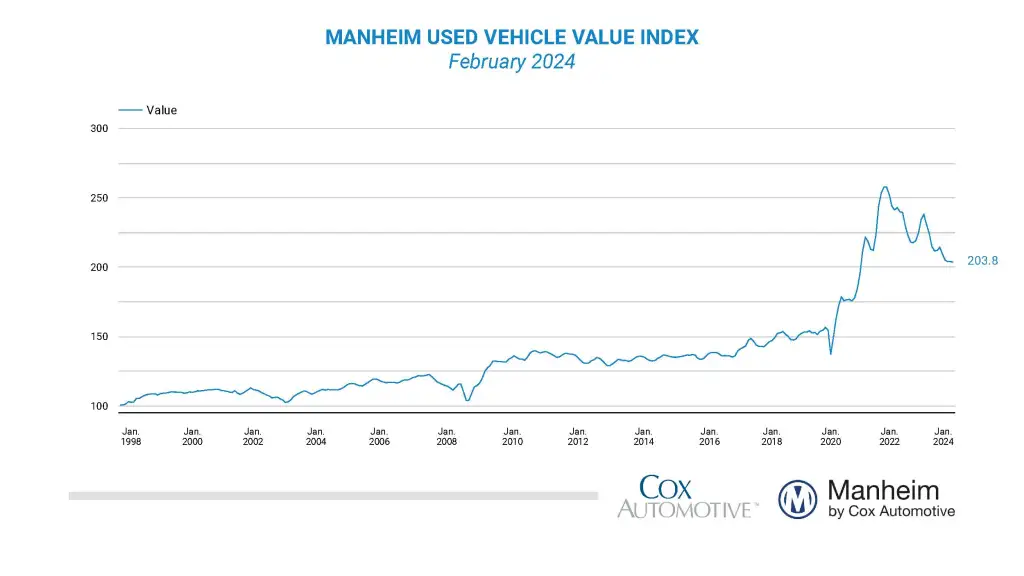
Used car prices jumped 44% in 2021. Demand for cars increased as public transportation became less appealing in a post-pandemic world. Supply chain issues prevented manufacturers from meeting demand.
The Manheim Used Vehicle Value Index, an index based on actual car sales, peaked in January 2022. It’s now 21% below its high and 13.1% lower than it was a year ago.
However, prices remain 32% higher than they were before the pandemic. That’s the ugly truth about inflation — even when prices come down, they’re still too high.
Traders Don’t Want to Believe the Fed
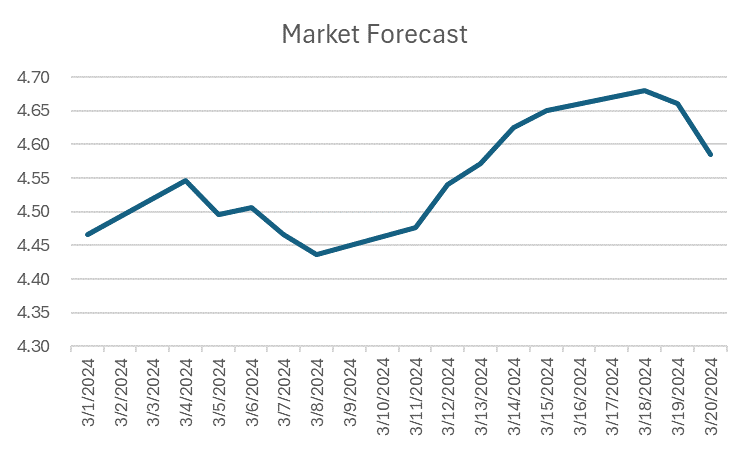
At this week’s meeting, Federal Reserve officials revised their interest rate forecasts. They told investors to expect three rate cuts this year. That was the same guidance shared three months ago and puts rates on track to land between 4.50% and 4.75% by the end of the year.
We can determine what traders believe rates will be at the end of the year based on fed funds futures. Prior to the meeting, traders were pricing in higher rates. The line in the chart shows the expected rate for the end of the year.
After the meeting on Wednesday, the expected rate dropped. Traders are once again expecting lower rates than Fed officials are telling us to expect.
Eventually, the market adapts to Fed guidance. That’s often accompanied by a strong sell-off in bonds as traders sell stocks to cover losses. That makes this indicator a “must watch” in the coming months. Hopefully, traders will revise their expectations gradually. Otherwise, a late-summer crash is possible.
That’s it for this week’s edition of Chart of the Day.
Until next time,

Mike Carr
Chief Market Technician