

Editor’s Note: Have you missed any of Mike Carr’s charts in Money & Markets Daily? We’ve got you covered. Monday to Friday, Mike highlights a chart that catches his eye — and what it could mean for markets or the economy going forward. Check out his analysis from the last week below.
Job Openings Are Collapsing
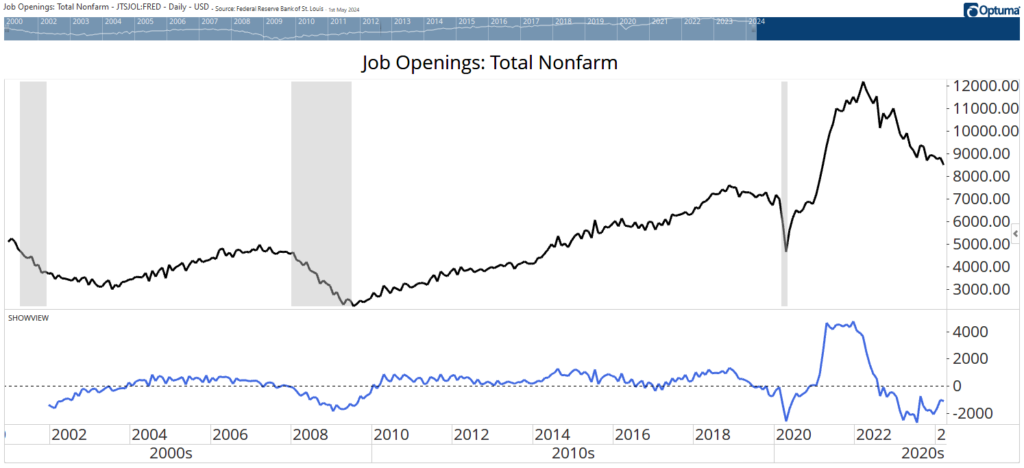
Job openings at the end of March fell to 8.49 million. That’s down 12% over the past year. The number of job openings per unemployed worker fell to 1.32. That’s still above the 2019 average of 1.19, but this ratio has been falling as the number of openings declined. It’s a sign of a tightening job market.
The chart below shows the total number of job openings and reveals that the market is tighter than many economists believe. The grey bars highlight recessions. At the bottom, you can see the year-over-year change in openings.
Job openings collapsed during the pandemic. They fell even more last summer and are still at levels associated with recessions. These low levels don’t mean a recession is likely. But slow growth is almost assured — which will create stock market volatility in an election year.
How the Government Is Causing Inflation
When Congress gives away money, someone steps up to take it, fueling inflation. We know that pandemic stimulus programs fueled higher prices. However, inflation data has been stronger than expected in recent months. The reason for that is more government spending.
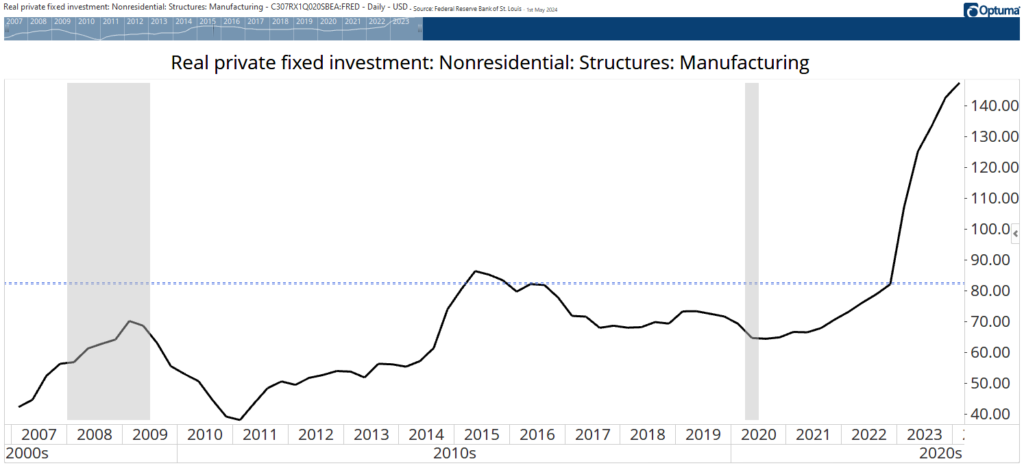
From the campaign trail, we regularly hear about green economy incentives in the Inflation Reduction Act and tech sector payouts in the CHIPS and Science Act. These laws are working as intended and have increased spending in manufacturing.
The chart below shows the increased amount spent on constructing manufacturing facilities. The billions spent to build buildings on top of the billions borrowed to fund those incentives is inflationary. The spending surge shows no signs of topping, which points to more inflation on the horizon.
ISM Points to Stagflation
The worst of all worlds for the economy is stagflation — stagnant growth with inflation. Last week’s survey of manufacturers from the Institute for Supply Management (ISM) showed signs of the worst.
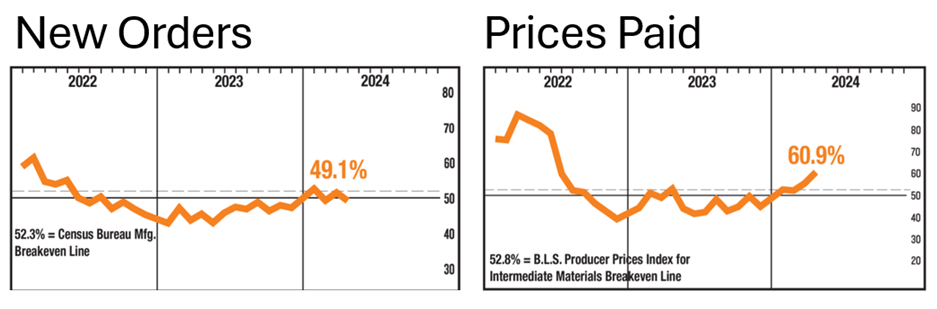
The report consists of a series of sub-indexes measuring essential steps of the manufacturing process. The ISM new orders data, shown in the chart on the right below, is at the beginning of the process. This index fell 49.1% in April. Values below 50% are consistent with contraction.
Prices Paid — an index of how much manufacturing inputs cost — jumped to 60.9%. Combining both indexes, we get an outlook that points to a manufacturing slowdown later this year. This will represent a drag on GDP while prices are rising, and that’s the worst of all possible worlds for the economy.
The Fed Has More Room to Breathe
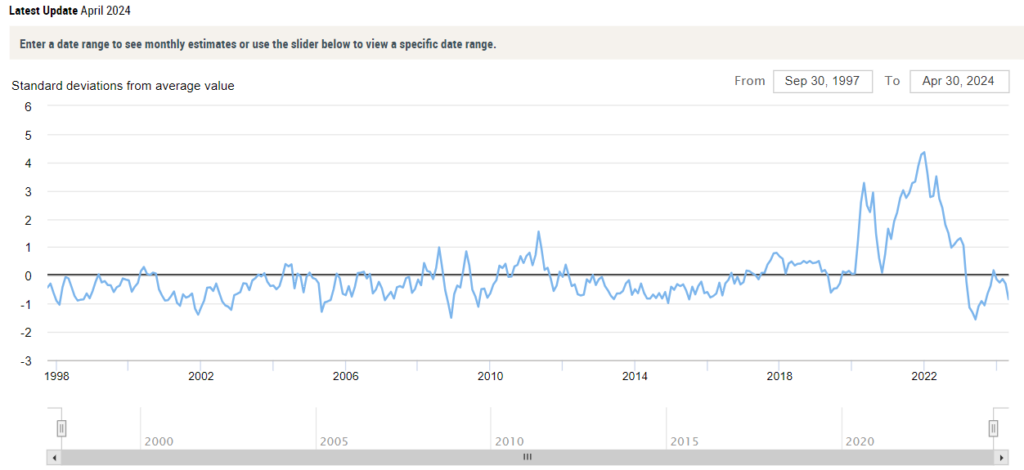
Last week’s employment report gave the Federal Reserve some room for optimism as the pace of job growth slowed. This week’s Global Supply Chain Pressure Index (GSCPI), shown below, adds to the Fed’s hope to cut rates this year.
Fed economists created this tool to spot potential problems in the supply chain after inflation soared in 2020. The index is trending down again after a brief move higher in November.
This movement is good news because it indicates deflationary pressures are likely to increase over the next six months, and lower inflation will allow the Fed to cut interest rates before the economy stalls.
Global Supply Chain Pressure Index Heads Lower
5,055 Reasons the Economy Is a Concern to Voters
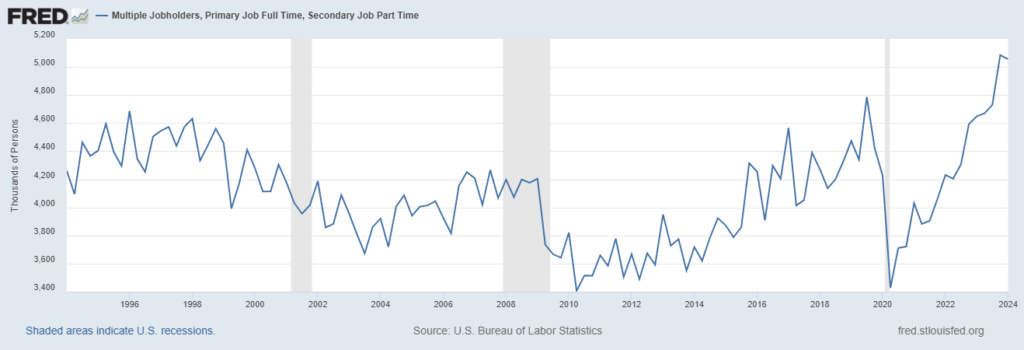
Politicians see things differently than the rest of us. Many politicians and pundits insist the economy is great. They point to a low unemployment rate of 3.9%. But that ignores the 5,055 individuals who hold both full-time and part-time jobs.
The chart below shows that this is a record high for this category of workers. The number of people holding both full-time and part-time jobs equals 3.1% of the total workforce.
These individuals likely don’t believe the economy is strong. They’re probably working a second job because their full-time job doesn’t pay enough. This is an overlooked indicator of the job market, and it tells us there’s trouble in the economy.
Number of Multiple Job Holders Reaches Record High
That’s it for this week’s edition of Chart of the Day.
Until next time,

Mike Carr
Chief Market Technician