

Editor’s Note: Have you missed any of Mike Carr’s charts in Money & Markets Daily? We’ve got you covered. Monday to Friday, Mike highlights a chart that catches his eye — and what it could mean for markets or the economy going forward. Check out his analysis from the last week below.
Why Unemployment Forecasts Are So Wrong
On Friday, the Labor Department announced that U.S. employers added a seasonally adjusted 303,000 jobs in March. That was significantly more than the 200,000 economists expected. The monthly report has consistently beaten expectations this year.
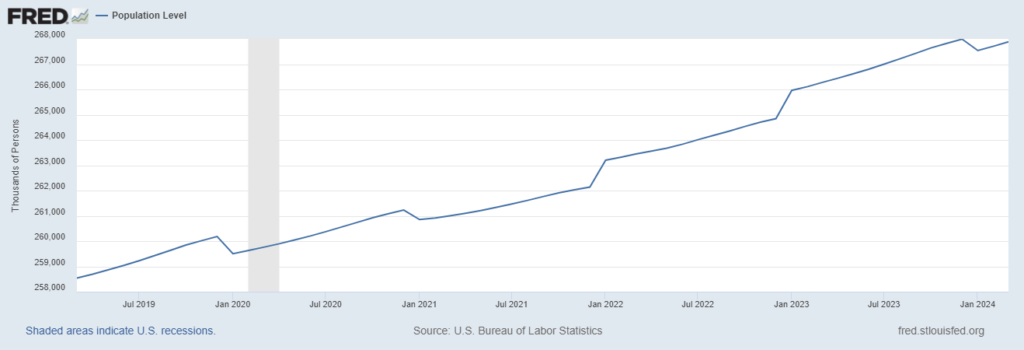
The official number, showing 303,000 new jobs, is based on a survey of businesses and government agencies. A second survey of households showed 469,000 new jobs. The difference between the two surveys and the forecasts seems to be based on a bad piece of data — the size of the population.
The Census Bureau provides an official estimate for the reports (shown in the chart below). The estimate shows steady increases except for annual revisions. However, the estimates don’t seem to include the irregular flows of immigrants at the southern border. No one seems to know the real size of the population, and that makes it impossible to forecast employment.
This is a significant problem because it understates economic growth for now and will understate the depth of the slowdown later. This points to a deep recession when it comes, whenever that is.
Census Bureau Estimate of New Jobs
The Inflation Battle Swings Toward the Fed
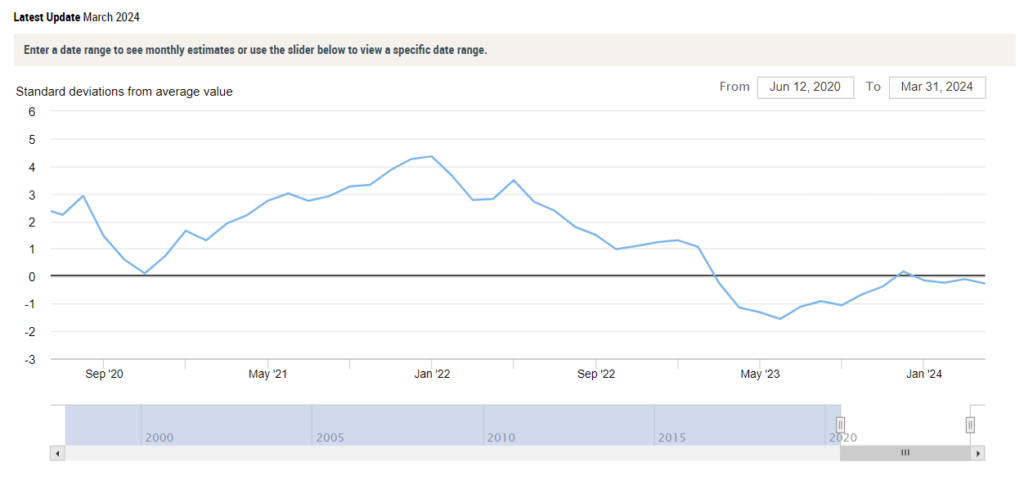
Last month’s Global Supply Chain Pressure Index (GSCPI) gave Federal Reserve officials cause for concern. The Fed created this tool after inflation soared in 2020 to spot potential problems in the supply chain before they affect consumers.
The index has been on a downtrend since peaking in December 2021. Negative values in the data show deflationary pressures. Last month’s reading (+0.10) indicated that the battle against inflation isn’t over. The Fed will be watching and worrying about this data point. The GSCPI dipped to -0.27 in March, and the February reading was revised to -0.11.
This is the kind of news the Fed wants to see, and it makes a rate cut by July almost certain. That said, investors need to consider protective positions, perhaps with put options on index exchange-traded funds (ETFs) like the SPDR S&P 500 ETF (SPY).
Are You Paying Wall Street 5.8X Too Much?
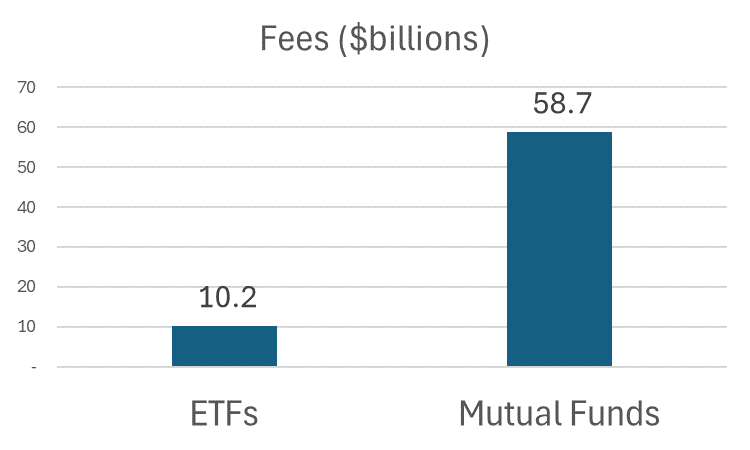
Investors have choices. To invest in broad stock market averages, they can buy low-cost exchange-traded funds (ETFs) … or they can buy more expensive mutual funds.
The right choice might seem obvious — buy an ETF with an average expense ratio of 0.15% — instead of a mutual fund, which charges an average fee of 0.42%.
Surprisingly, equity investors hold $14 trillion in mutual funds and just $7 trillion in ETFs. This means they pay fund managers $58.7 billion annually to manage mutual funds and just $10.2 billion to hold ETFs.
The difference means investors are giving billions of dollars to Wall Street that they might not need to. If you’re holding a mutual fund, ask yourself why, and consider changing now.
It’s Looking a Lot Like the 1970s
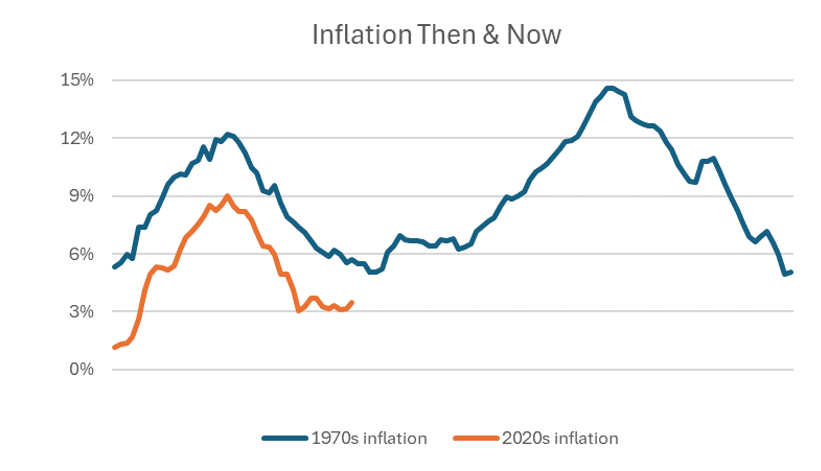
The latest Consumer Price Index (CPI) reading came in hotter than expected for the third month in a row. As inflation pushed higher three years ago, economists and Federal Reserve officials assured us it was transitory.
Of course, history tends to repeat, and that episode of confidence in the face of higher prices was similar to the bravado of officials in the early 1970s.
The chart below plots the two time periods. The blue line is the year-over-year change in CPI from the 1970s into the 1980s. The orange line is the current inflation track. Similarities are growing, and that tells us the worst inflation could be a few years away.
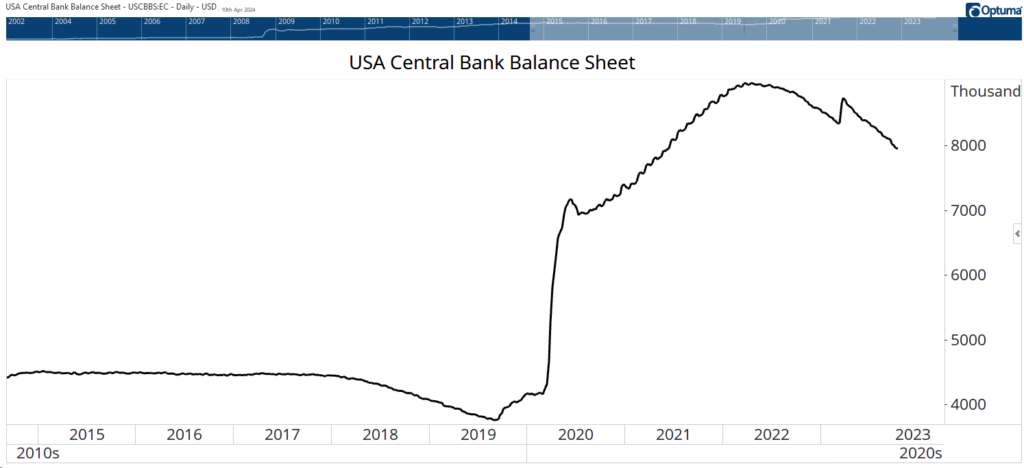
The Fed Doesn’t Have to Cut Rates
Traders were disappointed by the latest reading of the Consumer Price Index (CPI). The official data confirmed what every consumer knows — inflation is on the rise again. This news dampened hopes for interest rate cuts.
The probability of a cut at the Federal Reserve’s June meeting fell from 56% to 19% on Wednesday. But the minutes of the March meeting released later that day showed that the Fed might be ready to boost markets without cutting rates.
The Fed’s balance sheet reached $8.9 trillion in 2022 as officials pumped money into the economy. Increases in the balance sheet come from buying bonds, which adds money to the economy. For the last two years, the Fed has been reducing the size of the balance sheet and withdrawing money from the economy. The size of the balance sheet is shown in the chart below.
The minutes showed that in March, “The vast majority of participants thus judged it would be prudent to begin slowing the pace of runoff fairly soon.” If the Fed reduces its drawdown later this year, that could be equivalent to a 0.125% cut in interest rates.
The news could have an even more dramatic impact on the markets. It could be worth trading the SPDR S&P 500 ETF (SPY) calls before upcoming meetings to benefit from any changes to the balance sheet.
That’s it for this week’s edition of Chart of the Day.
Until next time,

Mike Carr
Chief Market Technician