London was different in 1854. It was so different that no one thought twice when a mother washed her baby’s diaper in a town well.
Now we know that’s not a good idea. We know that because Dr. John Snow traced an outbreak of cholera to that diaper-washing incident. Sadly, 616 people died before Snow’s discovery.
Doctors had seen cholera outbreaks before. Most recently in 1832 and 1849. Studying those cases, Snow concluded that cholera was spread by contaminated water. This was a novel theory at the time. Other doctors believed diseases all spread through the air.
As hundreds were dying, Snow talked to the survivors. He marked locations where individuals had died on a map. This led him to identify the source of contamination: a water pump near the large collection of black dots in the center of the map below.
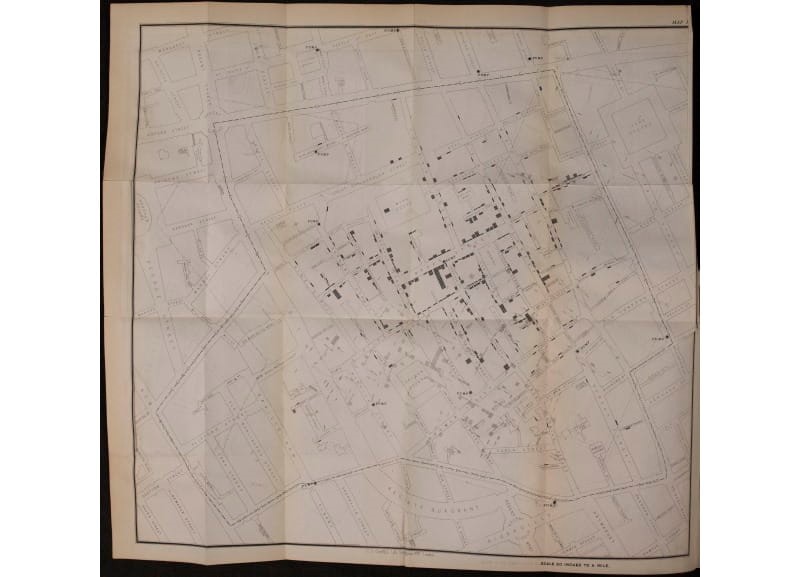
Source: Royal College of Surgeons of England.
Disabling that pump helped stop the disease. It also illustrated the importance of identifying and following patterns in data.
Pattern recognition was quickly adopted in other fields, one of them being the stock market.
Evolution of Pattern Recognition in Markets
Traders were using candlestick charts in Japan before 1800, but they were largely unknown in the U.S. or Europe until the 1980s. That’s when Steve Nison translated an old Japanese guide to the charts. Prior to that, western analysts relied on bar charts popularized by Charles Dow almost a century earlier.
A bar chart shows the open, high, low and closing prices each day. Dow had noticed the importance of this information in the late 1800s. Dow had founded The Wall Street Journal by then and described what he saw on the charts in editorials for the paper. Dow’s ideas are also still popular among traders. Dow Theory, as it’s known now, defines the direction of the trend from the chart pattern.
Dow noticed that stock prices tended to move in waves, and by identifying the patterns within these waves, one could anticipate where the market was heading with greater accuracy.
An accountant, R. N. Elliott, would take the idea of waves to a level Dow never imagined. In the 1930s, Elliott Wave Theory introduced the idea that patterns reflected repetitive cycles caused by the collective psychology of the market participants.
According to Elliott, these market cycles resulted in recognizable patterns in price movements, which could be categorized into waves. This theory gained traction and is still widely followed by traders.
Elliott’s work was released at the same time other analysts were cataloging simpler chart patterns. Richard Schabacker, Robert D. Edwards and John Magee produced thick tomes describing patterns like the head and shoulders top, rectangles and triangles.
The work of Dow, Elliott, Schabacker, Edwards and Magee (most of it almost 100 years old) still forms the cornerstone of traditional technical analysis, which is all based on pattern recognition.
However, the way we trade is beginning to change in a way never seen before. We’ve finally reached a point in history where recent technological advances now offer us the potential for monumental improvements in how we trade.
The Power to Find Uncharted Patterns
With new emerging technology and market knowledge, traders can unlock hidden patterns. They can see relationships that existed 100 years ago but were too difficult to uncover with paper and pencil and thereby left undiscovered.
However, this new way of trading doesn’t mean a fully automated process. Someday we may be able to turn computers loose and trade without any human oversight. High-frequency trading firms are able to do that today. But for most of us individual traders, that kind of trading isn’t yet accessible.
For now, computers are a trading tool that we need to guide and check to ensure the patterns they find make sense.
And that’s exactly what I’m doing now with a new system that uncovers never-before-seen patterns.
I designed this system to identify which Nasdaq 100 stock is set to gain the most over the next 30 days.
And you’ll get to see how it works in my “Top 1% Event” next Tuesday, November 14, at 1 p.m. Eastern time. Just grab the spot I saved for you by signing up here.
Until next time,

Mike Carr
Chief Market Technician