The start of a new year has been great for stock market bulls, but the underlying volatility complex is sending a number of warning signs.
Per Bloomberg, here are five different charts that provide clues to the next market crash that are keeping investors up at night:
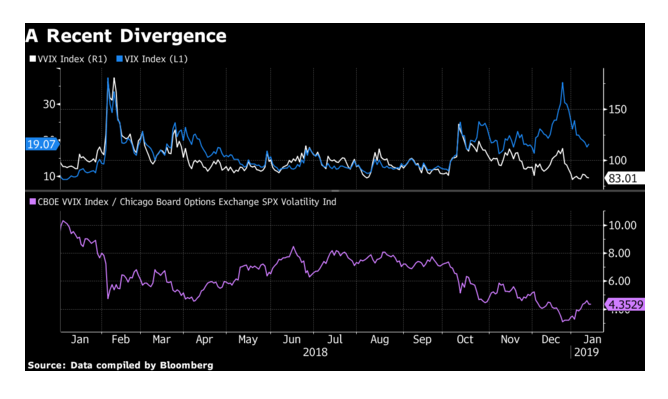
VVIX versus VIX
Right now, investors aren’t betting on a fresh breakout in outsized price moves, with a measure of expected swings in the VIX index plumbing multi-year lows. That may be a sign of complacency. Markets are “vulnerable to bursts” of volatility this year, warns Credit Suisse Group AG strategist Mandy Xu.
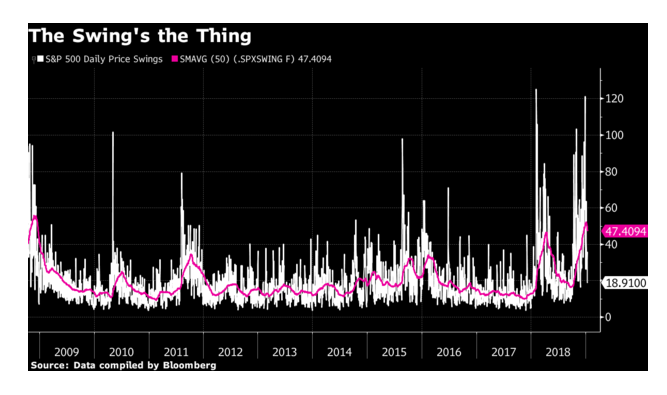
Intraday Volatility
What’s more, U.S. stocks have been bouncing around lately — a lot. The 50-day moving average of daily price swings in the S&P 500 is near its highest levels since December 2008.
“The increasing use and gain in popularity of weekly S&P 500 options — and SPY and e-minis — are potentially one important contributor to the intraday volatility of the S&P 500,” said Kambiz Kazemi, a partner and portfolio manager at La Financiere Constance in Toronto.
As an index approaches levels where the option strike price has high open interest, hedging needs can expand quickly and may contribute to abrupt accelerations in the underlying gauge, he warned.
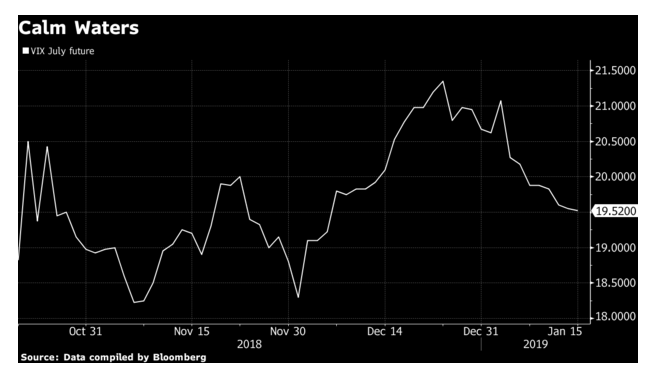
Belly of the Curve
Traders may also be too sanguine on the outlook for equity-price moves down the road. UBS Group AG strategist Stuart Kaiser said he’s watching VIX futures four to six months out, which for some time haven’t gone “meaningfully” above 20.
“Other than extreme events that has been a soft cap — so 23 or above for that part of the curve would be an issue,” he said.
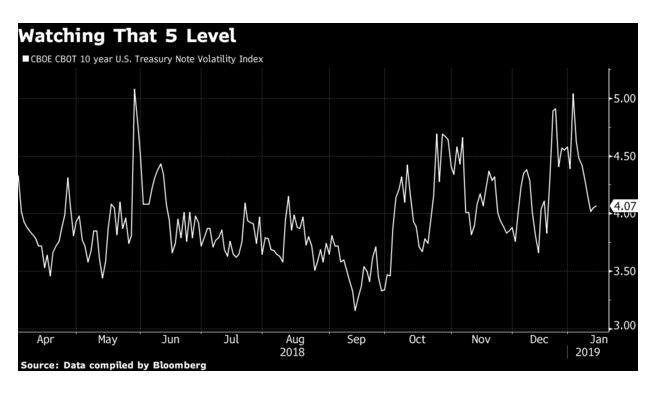
Treasury Volatility
The world’s largest bond market may be too calm for comfort. One volatility gauge for 10-year U.S. Treasury futures “now screens a touch low,” according to Kaiser. A breakout in interest-rate volatility is typically a lead indicator for regime shifts unfriendly to risk assets.
Demand for Hedges
Muted premiums for protective hedges over upside calls is another sign worth watching. It reflects either a flurry of bullish bets or a complacent shunning of market defenses — depending on whom you ask.
In 2018, it challenged hedging strategies for hedge funds and real-money investors alike.
It jumped, as expected, last February as investors sought safety in the bearish contracts. That wasn’t the case in the fourth quarter however, when the SKEW gauge fell while equities staged a meltdown.
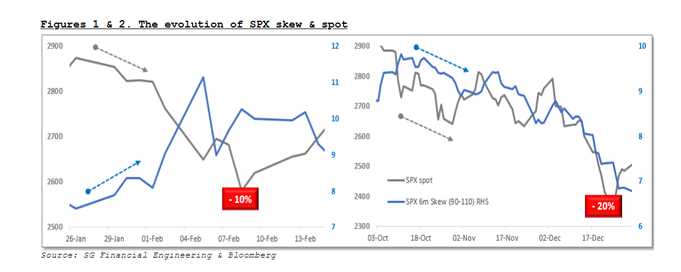
“This dynamic has very been much to the frustration of several clients, who were unable to monetize hedges to the degree of profitability that they had presumed they would,” said Andrew Scott at Societe Generale SA.
On the bright side: downside hedges have rarely been this cheap.