

Well, the numbers are in, and March was not a great month for the three major U.S. indexes.
Institutional investors were “risk-off” amid joint U.S.-Israeli strikes against Iran… and Iran’s subsequent retaliatory strikes against the U.S. and other Gulf nations.
The strikes caused a spike in oil prices worldwide and reignited concerns about global inflation.
As a result, markets tumbled in March.
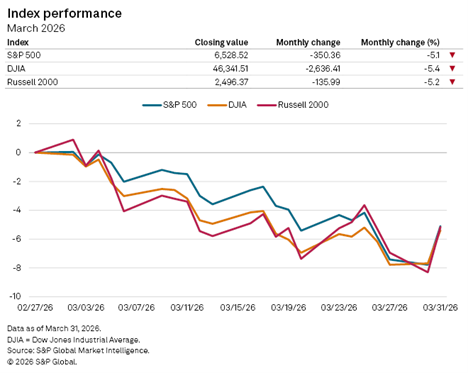
Major Indexes Fall 5% or More in March
The benchmark S&P 500 Index fell 5.1%, while the Russell 2000 Index dropped 5.2%, and the Dow Jones Industrial Average was off 5.4% for the month.
On the other hand, oil spiked as Iranian officials closed the critical Strait of Hormuz… a waterway that carries nearly 20% of the world’s oil.
By the end of the month, Brent crude — the international oil benchmark — traded above $112 a barrel on March 31, up from $70.75 at the start of the month.
Now, let’s break down March’s performance by individual sector…
One Sector Outperforms All
With the rise in oil prices globally, it’s no surprise that the energy sector saw sizeable gains in March.
What is surprising is that it was the only sector that posted a positive return:
Energy Gains While Others Stumble
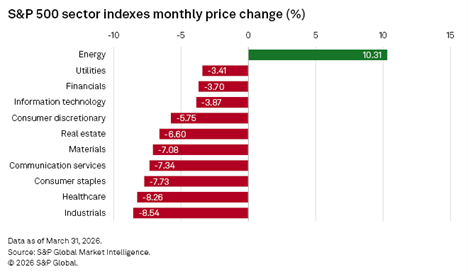
For the month, the energy sector rose 10.3% in aggregate, with 19 of the sector’s 22 stocks posting gains.
According to financial data platform S&P Capital IQ Pro, APA Corp. (APA) and Marathon Petroleum Corp. (MPC) led the sector in gains. Those stocks rose 39.7% and 23.2%, respectively.
On the other hand, the industrial sector dropped by more than 8.5% in March, marking the steepest decline among the 11 sectors. All but four of the sector’s 79 stocks posted decreases for the month.
To go a step further, I used a screen to track the performance of all 11 sectors over different time periods:
Energy Remains King for One-Year Returns
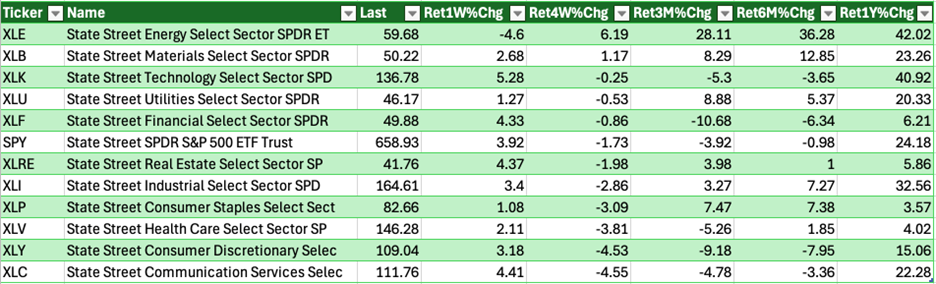
Over the last week, the energy sector has been the lone laggard, posting a 4.6% decline.
For the last 12 months, however, energy has been the strongest performer of the index with a 42% return. Close behind is technology with a 41% increase.
Looking Ahead To April
As I mentioned last week, the first quarter of 2026 was one that most investors would like to forget because the S&P 500 posted one of its worst quarters in recent years.
Index moves were extremely sensitive to headline updates, as evidenced by the broad market rising 2.9% on March 31 after reports that the U.S. may end military operations against Iran.
In that essay, I cited information from Bespoke Investment Group that since 1990, April has been one of the best months of the year for U.S. equities.
The S&P 500 has averaged a 1.50% gain in April. The Dow has done even better, up an average of 1.83%. Even the beaten-down Nasdaq 100 has averaged a 1.35% gain.
More importantly, those aren’t just flukes driven by a handful of massive outlier years. The S&P 500 has closed April in positive territory 72% of the time, going back to 1990 — among the highest win rates of any month on the calendar.
With March’s sell-off, there is a lot of cash sitting on the sidelines, making a bounce to the upside in April very possible.
Additionally, the next quarterly earnings season is set to kick off, which could also support a rebound for all three indexes.
In my Friday earnings report, I mentioned that analysts have increased earnings estimates for S&P 500 companies by 0.4% since the end of 2025.
On a year-over-year (YOY) basis, the S&P 500 is expected to report earnings growth of 13.2%. If that holds, it would mark the index’s sixth straight quarter of double-digit earnings growth.
While headlines will impact stocks in the short term, it’s earnings growth that will have the biggest impact in the long run.
That’s all from me today.
Until next time…
Safe trading,

Matt Clark, CMSA®
Chief Research Analyst, Money & Markets