Through the close of trading Wednesday, the S&P 500 had fallen 9.4 percent for the month of October, which isn’t quite a 10 percent correction but close enough to take a look at what has happened when stocks crash from a historical perspective.
The question many investors would like to know is: How much further is it going to fall?
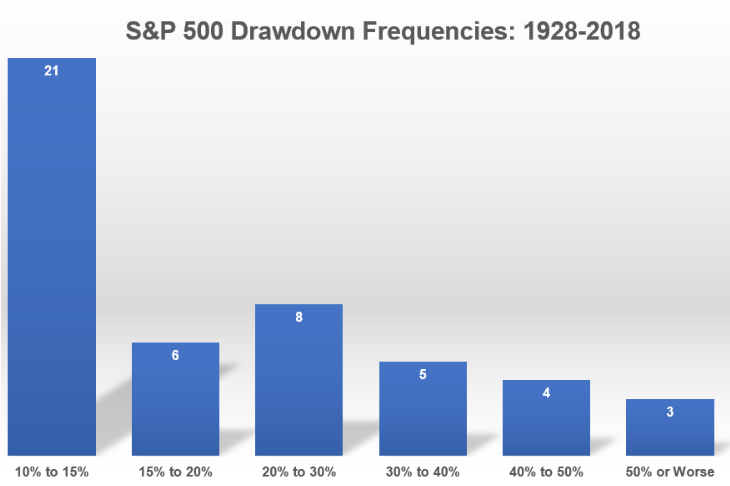
A recent post by A Wealth of Common Sense took a look at what has happened historically after a 10 percent correction going all the way back to 1928:
When stocks fell 10%
- 44.7% of the time they didn’t fall any further than 15%
- 12.8% of the time they didn’t fall any further than 20%
- 17.0% of the time they fell between 20% and 30%
- 10.6% of the time they fell between 30% and 40%
- 8.5% of the time they fell between 40% and 50%
- 6.4% of the time they fell more than 50%
When stocks fell 15%
- 23.1% of the time they didn’t fall any further than 20%
- 30.8% of the time they fell between 20% and 30%
- 19.2% of the time they fell between 30% and 40%
- 15.4% of the time they fell between 40% and 50%
- 11.5% of the time they fell more than 50%
When stocks fell 20%
- 40.0% of the time they didn’t fall any further than 30%
- 25.0% of the time they fell between 30% and 40%
- 20.0% of the time they fell between 40% and 50%
- 15.0% of the time they fell more than 50%
When stocks fell 30%
- 41.7% of the time they didn’t fall any further than 40%
- 33.3% of the time they fell between 40% and 50%
- 25.0% of the time they fell more than 50%
When stocks fell 40%
- 57.1% of the time they didn’t fall any further than 50%
- 42.9% of the time they fell more than 50%
When stocks fell 50%
- 66.7% of the time they didn’t fall any further than 60%
- 33.3% of the time they fell more than 60%
In a nutshell, about 60 percent of the time when you have a 10 percent correction, it has not led to a bear market, and 40 percent of the time it has.
The average correction which saw stocks drop 10% but not enter bear market territory was a drawdown of -14%, lasting 132 days from peak-to-trough. Bear markets in this time frame experienced a drawdown of -37% over 358 days, on average.
Historical information like this can help put things into perspective but historical data is rarely enough to help people sleep at night or change their behavior. Market averages tell a story but no one’s experience in the markets is ever average in the moment.
The past is easy because we know what happened but the future is messy since the uncertainty of the potential outcomes cannot be reduced.
Most of the time the stock market has a run-of-the-mill correction that doesn’t turn into a bear market but a bear market is always a possibility.
So what can you do? Prepare. Bake these crash scenarios into your portfolio in advance so you’re ready when the inevitable next crash hits and have a plan. Even a bad plan, is better than no plan at all.