You don’t always need huge rallies or steep drops to drive emotional trading. Emotions run high for many investors even as stock prices move sideways.
That’s because a lack of movement gives investors time to think… And thinking often leads to anxiety or fear.
When prices are rallying, like they did last week, there’s no time to think. The only thing some investors do when prices are moving higher is buy. In recent years, we’d call them FOMO investors. There’s just no time to think when you’re driven by a fear of missing out.
There’s no time to think when prices fall, either. Investors who bought overpriced tech stocks in the rally are losing money. They feel pain, and even if selling won’t make the pain stop, it will stop the losses from growing.
When prices move sideways, like they did in April and May, emotional investors don’t have a reason to trade. Instead, they worry. About the economy. Or interest rates and inflation. Or valuations and the housing market. The list of worries is long … and often meaningless.
I’m an individual investor. I understand that I can’t influence the economy or market price levels.
Of course, I can always worry about those things. But WebMD says that worry can make me physically sick … so I don’t.
Instead, I trade the market we have. And that’s effective whether we’re in a sideways market, a bull or a bear.
Especially when you use one simple method that focuses only on the most significant part of each day … the 15 minutes after the open.
Trading the Market in Front of Us
Trading is different than investing. I’m not searching for the next tech trend or the best management team in an undervalued company. I’m looking for an opportunity to profit from the market I see in front of me.
I share different short-term trading strategies for that in my Trade Room every morning. The room opens right with the stock market at 9:30 a.m. ET (Monday through Friday). For the next hour, hundreds of traders and I go over trade candidates that the strategies triggered for us.
Our most popular strategy is the opening range breakout, or ORB.
The rules for this strategy are in its name. We watch the open of the S&P 500 and Nasdaq 100, noting the range in the first 15 minutes. Then we find the day’s breakout levels. By 9:46 a.m. ET, we have the day’s trade plan based on those levels.
If prices exceed a certain level, we buy a call option that will benefit from a continued move in that direction before 12 p.m. If we see the opposite and prices fall, we buy a put option to benefit from the same dynamic.
We also email this to all our readers so that they have the opportunity to place ORB trades even when they can’t make it in the room live.
We’ve had many traders in the Trade Room recently share their excitement for scoring frequent gains with this strategy…
Edward G.: I hit 50% on both SPY & QQQ.
Carmina G.: 50% on both QQQ and SPY yesterday. Thanks, Mike and Matt!
Curtiss D.: Yesterday SPY puts came thru with 50% WIN — ORB works!!
John G.: A trifecta of 50% gains — SPY, QQQ, TAP! Thanks, Mike & Matt.
Joanne K.: SPY yesterday (puts) made 104%.
Jeff M.: Cleared 55% on ORB yesterday. Great trade.
Brian A.: Thanks, Mike. 50% gain in Spy and QQQ in 32 minutes!!!!
Timothy M.: Good trading day yesterday for ORB: +50% on SPY and +40% on QQQ.
Steven K.: 53% and 51% on yesterday’s QQQ and SPY. ORB is the best strategy I’ve ever seen.
These were just some of the countless results shared by attendees in the room over the past couple of months.
Of course, everyone’s results will vary based on individual entry and exit prices and broker executions. But overall, this strategy is certainly moving the needle and helping us beat the market.
Let’s take a more detailed look at the official performance of the strategy that we’ve been tracking…
ORB More Than Doubled $1K Invested in 2 Months
ORB is especially exciting when you compare it to the mostly sideways market of the past two months. The S&P 500 benchmark is up just over 4% in that time, with most of the gains coming in just the last couple weeks.
I compared that to the past two months of our ORB strategy shown in the chart below. These are the actual results of the recommendations shared at 9:46 a.m. ET every day over that time period.
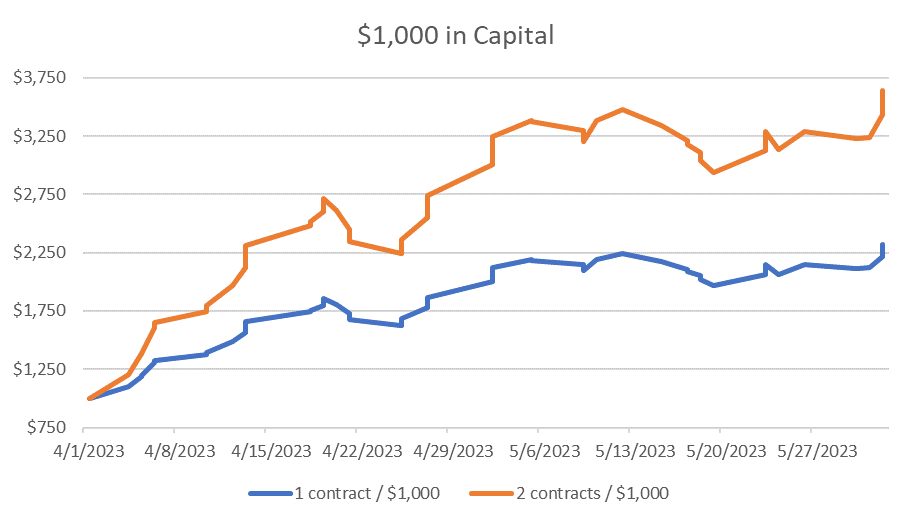
On average, each trade costs about $200 per contract. Aggressive traders could trade two contracts for each $1,000 in capital they commit to this strategy. Conservative traders should use one contract.
In two months, that $1,000 more than doubled, delivering a $1,320 profit for one contract and $2,640 for two contracts. That means, at minimum, ORB outperformed the S&P 500 by 33 times over the last two months.
The chart shows that gains were often followed by losses. For weeks, the account can move sideways. That may be frustrating in the moment, but it’s just a part of trading.
And that’s why we also have other strategies that we follow in the room. For example, one of our conservative options income strategies has gained 40% on a $1,000 starting account so far this year.
Trading like this isn’t for everyone. The ORB strategy always tells us exactly what we need to do every day the market is open. It gives us a reliable plan to strive for profits regardless of what is happening in the markets or economy. So for those who move impulsively with FOMO or just like to worry, this may not be appealing.
But if you want to trade the market as it is — not to mention double your money in two months in flat price action — then this might be for you.
For a short time, we’re opening access to the Trade Room to welcome the next group of dedicated traders into our community. All the details on how to join me and start trading the ORB method, along with some other personal favorite strategies, are right here.
Until next time,

Mike Carr
Senior Technical Analyst