
After plummeting more than 13% since the beginning of the year, the S&P 500 is due for a bounce. One way to determine when that bounce is likely is with market breadth indicators.
Breadth indicators are designed to measure how many stocks are participating in the stock market’s broader trends.
Like many trading concepts, a military analogy can explain market breadth. The idea is that a general cannot win a war by himself. Leaders needs troops supporting the effort to win the battle. If the troops don’t follow the general, their leader is likely to meet a grim fate at the hands of the enemy.
In the stock market, major market averages are considered the generals. Breadth indicators calculate how many troops are following the generals.
There are many ways to do that, but of course some are more useful than others.
Market Breadth Indicator MACD Leads the Charge
I prefer to look at the percentage of stocks on a MACD buy signal.
MACD is a popular momentum indicator. It tends to turn slowly, so the signals often reveal the direction of the trend without a large number of short whipsaw trades like other momentum indicators provide.
MACD is at the bottom of the chart below. It’s a chart of Apple, the largest component of the S&P 500. And it’s on a sell signal.
MACD Signals Sell for Apple
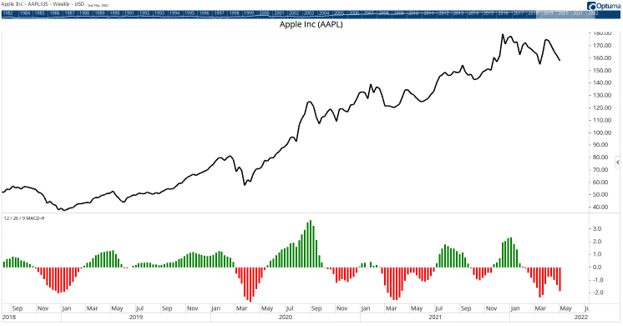
Source: Optuma.
Apple isn’t the only stock on a MACD sell signal. More than 65% of the stocks in the S&P 500 are on sells. This is an unusually low reading.
In the past, the index has rallied 67% of the time a month after that first sell signal. The most important part of this signal is a value quantitative analysts call the maximum adverse excursion (MAE).
MAE Day
The MAE shows the largest loss suffered in a winning trade. It’s the worst downside price move you’d suffer after buying. At just 4.8%, the MAE is low enough to help us plot a trading strategy for the next month.
We have a 67% probability of success if we buy the SPDR S&P 500 ETF (NYSE: SPY). If the price of SPY drops 5% below the entry price, sell the position. Otherwise, hold for one month.
Bottom line: That’s it. Market breadth is so bad that it’s telling us to buy. In other words, the general is likely to lead a new attack, and the troops are ready to follow.
Michael Carr is the editor of True Options Masters, One Trade, Peak Velocity Trader and Precision Profits. He teaches technical analysis and quantitative technical analysis at the New York Institute of Finance. Follow him on Twitter @MichaelCarrGuru.