
One way to see if buying is broad-based is by looking at market capitalization, which is the total value of a company’s shares of stock.
Not all bull markets are the same. But the strongest bulls share a certain pattern.
In a healthy market, investors buy almost everything. That’s not what we’re seeing right now. Much of the buying is concentrated in just a few stocks.
Market Capitalization: Large-, Medium- and Small-Caps
One way to see if buying is broad-based is by looking at market capitalization, which is the total value of a company’s shares of stock. To find market capitalization, analysts simply multiply the number of shares a company issued by the market price of the stock.
For example, a company with 10 million shares trading at $100 a share has a market cap of $1 billion.
Analysts generally define a stock with a market cap above $10 billion as a large-cap company. These include most of the companies in the S&P 500. They’re well-known stocks like Apple Inc. (Nasdaq: AAPL) or Google, whose parent company is Alphabet Inc. (Nasdaq: GOOGL).
Mid-cap stocks are those valued between $2 billion and $10 billion. Small caps are stocks under $2 billion in market capitalization. Some analysts use different specific definitions, but the general idea is the same.
Smaller stocks have more risk and should have higher returns. Large caps have the least risk and should have the lowest returns. The chart below shows that’s not the pattern that’s unfolded since stocks bottomed in March. Traders have bought large caps and the large index delivered the best returns.
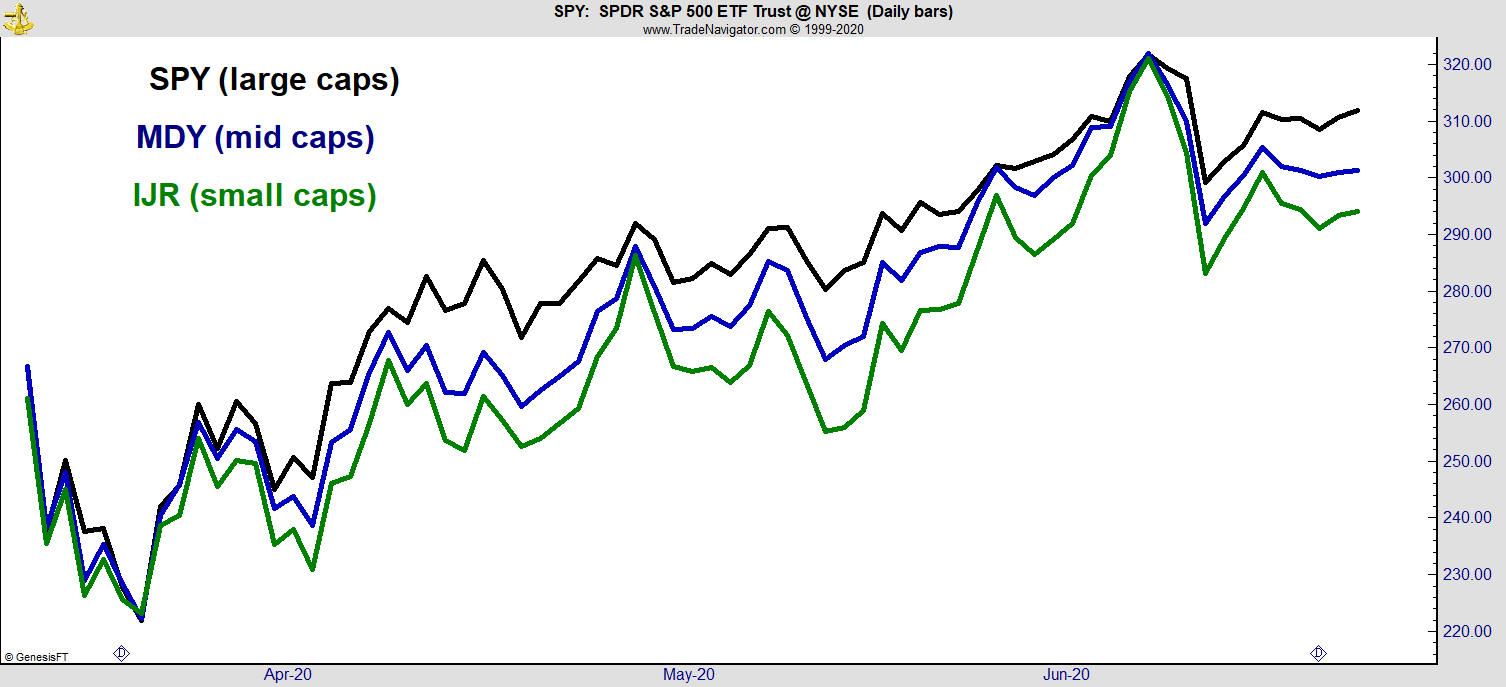
Source: Trade Navigator
In the chart, large caps are shown as the SPDR S&P 500 ETF Trust (NYSE: SPY). SPDR S&P Mid Cap 400 ETF Trust (NYSE: MDY) represents mid-cap stocks. iShares Core S&P Small-Cap ETF (NYSE: IJR) is an ETF that tracks small caps.
The current pattern is not what we saw in March 2009, when small caps and mid caps outperformed large caps. That bull market started strong and lasted more than 10 years. That’s also not what we saw in October 2002, when a five-year bull market kicked off.
This current bullish price move looks like it is in trouble. The next chart shows MDY and IJR. At the bottom is a momentum indicator that often identifies timely changes in the trend.
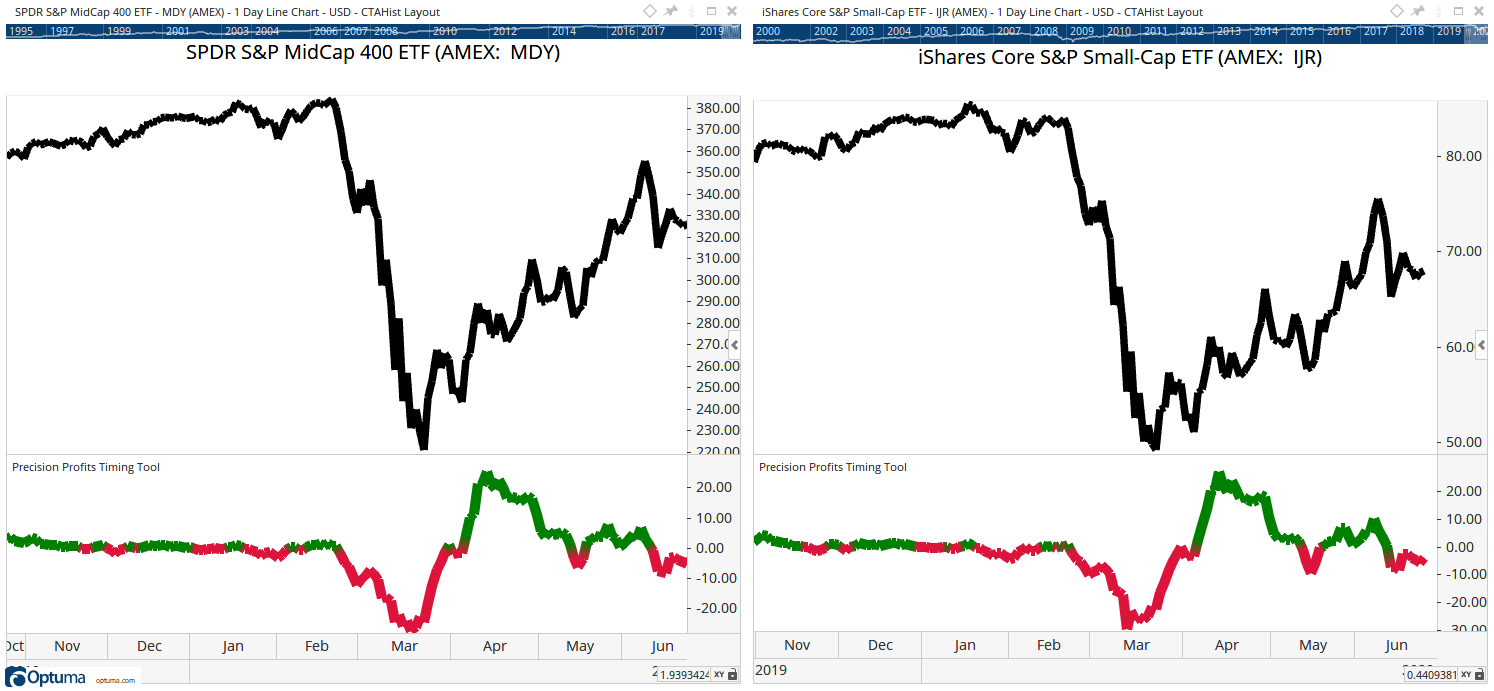
Source: Optuma
Weakness in smaller stocks is a warning that the bullish move since March is near an end. That would mean this was a bear market rally and lower lows are coming for stocks.
While it’s possible a bull market can occur without smaller stocks moving up, it’s unlikely. In fact, it’s never happened before.
• Michael Carr is a Chartered Market Technician for Banyan Hill Publishing and the Editor of One Trade, Peak Velocity Trader and Precision Profits. He teaches technical analysis and quantitative technical analysis at New York Institute of Finance. Mr. Carr also is the former editor of the CMT Association newsletter Technically Speaking.
Follow him on Twitter @MichaelCarrGuru.