
Editor’s Note: Adam O’Dell’s Green Zone Power Rating system drives much of what you read daily here in What My System Says Today … but stay tuned. Adam is about to reveal a brand-new tool he’s developed that’s tuned to capitalize on stocks with incredible kinetic momentum. And he’s going to show you exactly how to implement it in your trading journey…
The S&P 500 and Nasdaq Composite have been on pretty strong runs of late.
On Monday, both indexes closed at new highs. Tuesday saw some shakiness in the Nasdaq, but the S&P 500 charged even higher. Early trading this morning looks promising as well after President Trump announced a new trade deal with Japan.
In the trading world, unless you are gambling on a market collapse, major indexes reaching new highs is good news.
However, there could be a signal in the market telling us things are about to slow down.
It’s a signal we haven’t seen this strong since the dot-com bubble between 1998 and 2000.
This signal doesn’t mean we will see a repeat of the late 1990s, but I believe it is one investors should pay attention to.
Let’s get into it…
Market Tear Since Liberation Day
In early April, Trump announced a series of tariffs on goods imported into the U.S. from most nations.
The idea was to “level the playing field” against countries that impose high duties on goods coming from the U.S.
These proposed levies sent the market into a downward spiral faster than you can say “reciprocal tariffs.”
The S&P 500 dipped below 5,000 for a 52-week low, and the Nasdaq Composite dropped below 15,500.
Trump’s administration reversed course, delaying most of the tariffs, and since then, these indexes have ignited to new highs.
The signal I mentioned earlier refers to the moving averages of both indexes and where the S&P 500 and Nasdaq are closing relative to those averages.
S&P 500 Roars Above Short Moving Average
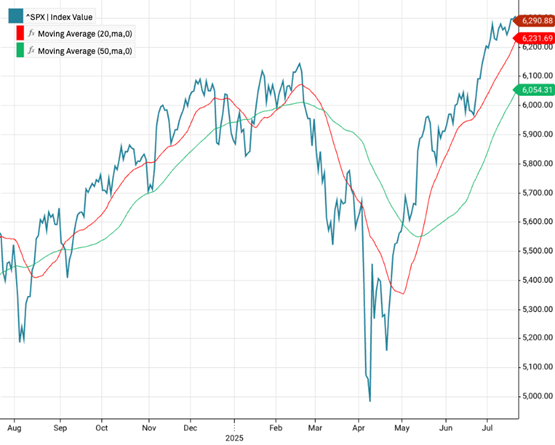
As of Monday’s close, the S&P 500 has traded above its 20-day moving average (red line in the chart above) for 60 days.
The index has closed above its 50-day moving average (green line) since the beginning of May.
We’re seeing the same trend in the Nasdaq…
Nasdaq Trades Above Moving Averages
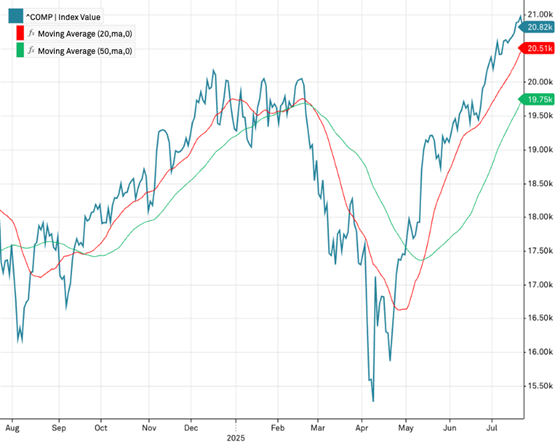
The tech-heavy index has traded above that moving average since late April and above its 50-day average since May.
This isn’t the first time we’ve seen the indexes trade above these short-term moving averages this long…
But, This Isn’t 1999 … Is It?
In the late 1990s, the S&P 500 and Nasdaq were both on a similar tear thanks to the dot-com boom.
Technology stocks and initial public offerings fueled this rally, which saw the Nasdaq jump more than 80% in a year.
What’s interesting to see is how the market reacted after spending nearly two months trading above short-term moving averages.
S&P 500 Enters Range-Bound Trading In 1999
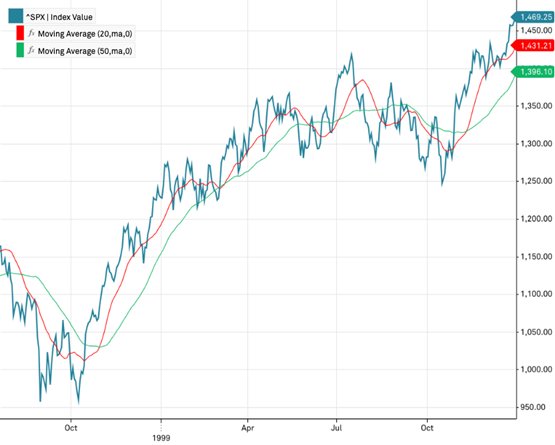
From October 1998 into early 1999, the S&P 500 traded above its 20-day and 50-day moving averages.
At the beginning of 1999, that changed, and the 20-day moving average crossed above the index close.
That set off a period of sideways trading, before the index dipped below 1,250 in October, then rose again to close out the year.
Similar story with the Nasdaq…
Nasdaq Trades Tighter In 1999

The Nasdaq actually traded in a tighter range than the S&P 500 after the short-term moving averages crossed above closing prices.
The rally picked up again, like the S&P 500, in October.
The dot-com bubble burst in the following year, sending markets downward. Sky-high valuations pushed the bubble to the breaking point in 2000.
However, it’s important to note that while valuations are high again now, they are not close to the levels we saw in 1999 and 2000.
S&P 500 Valuations Remain Lower Than 2000s
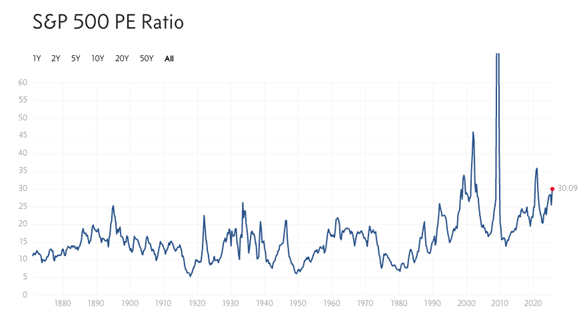
Currently, the S&P 500 is trading with a price-to-earnings ratio of 30.1. That’s not close to the top of the dot-com bubble burst in December 2001 (46.2), and a long way off of the May 2009 high (123.7).
So, while past performance is not indicative of future results (love that saying), it might be wise to look on the horizon for potential sideways trading in both indexes.
Of course, that doesn’t mean you have to sit on your hands either. If you haven’t already, be sure to check out Adam’s flagship investing service, Green Zone Fortunes, today. Along with a model portfolio full of stocks built to outperform in this market, you’ll also gain full access to our Green Zone Power Rating system so you can “roll up your sleeves” and find more stocks that rate “Bullish” or “Strong Bullish” now.
That’s all from me today.
Safe trading,

Matt Clark, CMSA®
Chief Research Analyst, Money & Markets