
Nike Inc. (NYSE: NKE) has an inventory issue.
People just aren’t buying sneakers and other apparel as much as they used to.
And the proof is in the numbers.
In September, Nike reported $12.7 billion in revenue for the previous quarter. But gross margins sank another 2.2% — and Nike higher-ups signaled that contraction wasn’t over.
Excess inventory was the biggest cause.
Hopefully, for consumers like myself, this means some good deals on Nike apparel is around the corner.
But for the company, this loss has affected the stock’s performance for the year.
NKE scores a “Bearish” 24 out of 100 on our proprietary Stock Power Ratings system.
Let’s dig deeper into its recent dip.
NKE’s Recent Plunge
NKE faced a rut.
At the end of September, shares dropped 12%, which put it on the path to closing at its lowest point since April 2020.
That was the height of the COVID pandemic.
Excess inventory is a big factor for the sharp drop.
Rising inflation has driven inventories higher as consumers have cut back on spending. Inventory issues are also plaguing several larger retailers such as Target.
Nike’s inventory grew 44% this quarter. At the forefront was a 65% increase in North America.
Nike has already started offering significant discounts on its merchandise to offset the glut.
It seems like a smart, quick fix for the problem at hand.
But this inventory issue is a problem that will not have a quick fix for the company.
With its dilemma in mind, let’s look at its Stock Power Ratings breakdown to see how NKE ranks against its peers.
Nike Stock Power Ratings Breakdown
For “Bearish” stocks, I like to focus on the factors rating lower.
After taking a quick look at those, I’ll zoom in on NKE’s value and momentum to see its performance compared to industry peers.
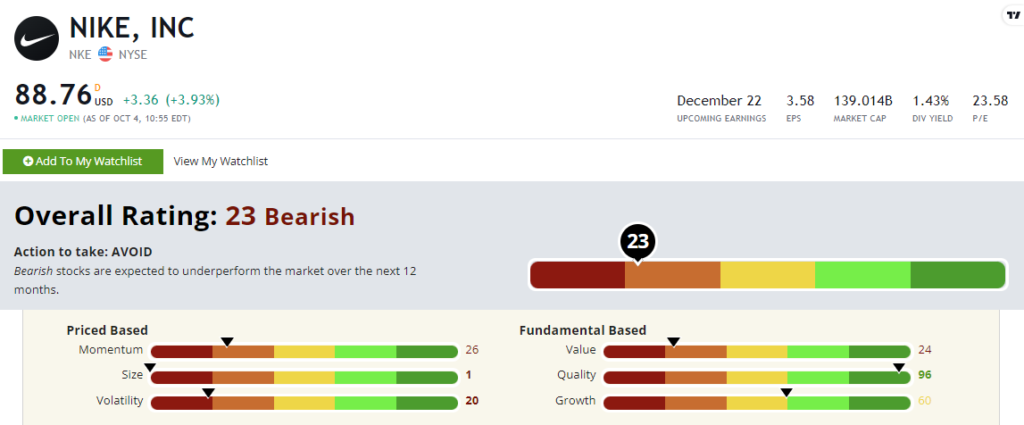
NKE’s Stock Power Ratings in October 2022.
- Size — With an undeniable logo, it is no surprise that Nike is a massive company. Its market cap of $134.63 billion means NKE scores a 1 on our size factor.
- Volatility — NKE earns a 20 on volatility due to its rough performance throughout the unpredictable market.
- Growth — I can explain this best with an image:
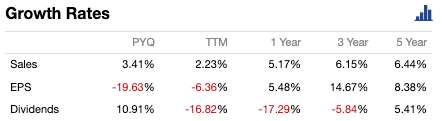
As you can see, NKE’s recent earnings per share aren’t great. At the same time, NKE’s sales growth rates haven’t gone above 6.4% in the last five years. This earns a neutral 60 on our growth metric.
Now let’s get into NKE’s momentum.
NKE’s Momentum
It’s been a bad year for NKE.
Ongoing market pressures continue to push the stock down, as seen in the chart below:
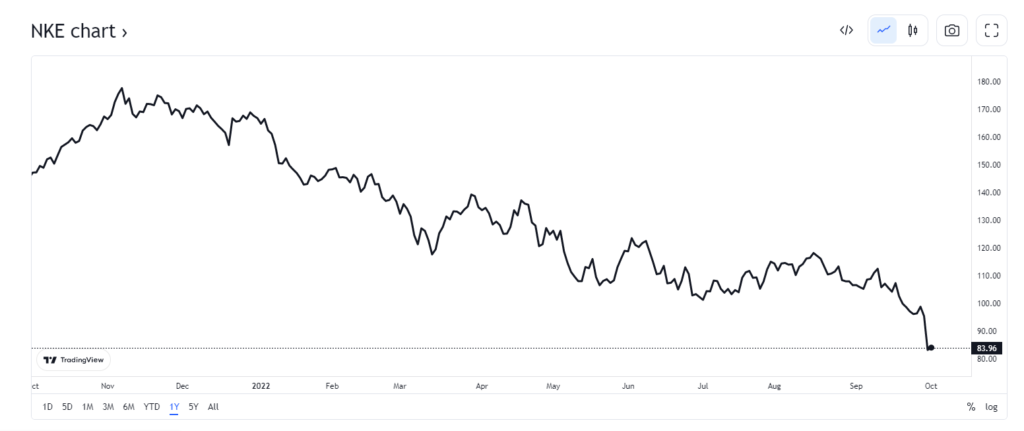
Source: Tradingview.
Its 52-week high of $175.85 crashed to a 52-week low of $83.12 in September.
That’s a 52% loss for NKE in less than a year.
This downward trajectory with no sign of an upward turnaround for the stock earns NKE a 26 out of 100 on our momentum factor.
Let’s focus on its value to see how NKE is competing against its industry peers.
NKE’s Value
With consumers spending less due to inflation, the apparel and accessory industry is taking a hit.
Nike’s price-to-earnings ratio is 24.22, compared to the industry average of 9.60.
Its price-to-sales ratio is 2.87, more than triple its peers’.
While its price-to-book ratio shows a difference for NKE at 8.56, its industry sits at 2.17.
In simpler terms, these numbers mean one thing: NKE is overvalued compared to its industry peers.
This earns NKE a 24 on our value metric.
The Bottom Line
People are not buying nearly as much with inflation roaring. And Nike is one company feeling the pressure.
Nike scores a “Bearish” 24 out of 100 on our Stock Power Ratings system.
However, “Strong Bullish” stocks are no anomaly.
We expect those stocks to beat the broader market by 3X in the next 12 months!
To get one highly rated stock you should consider investing in every weekday, check out Matt Clark’s Stock Power Daily.
Monday through Friday, he gives you one stock that scores 80 or above on our system and tells you why you should add it to your portfolio — for free!