It doesn’t matter who you are, how much money you have, or even what you are shopping for; you will always seek out a good deal.
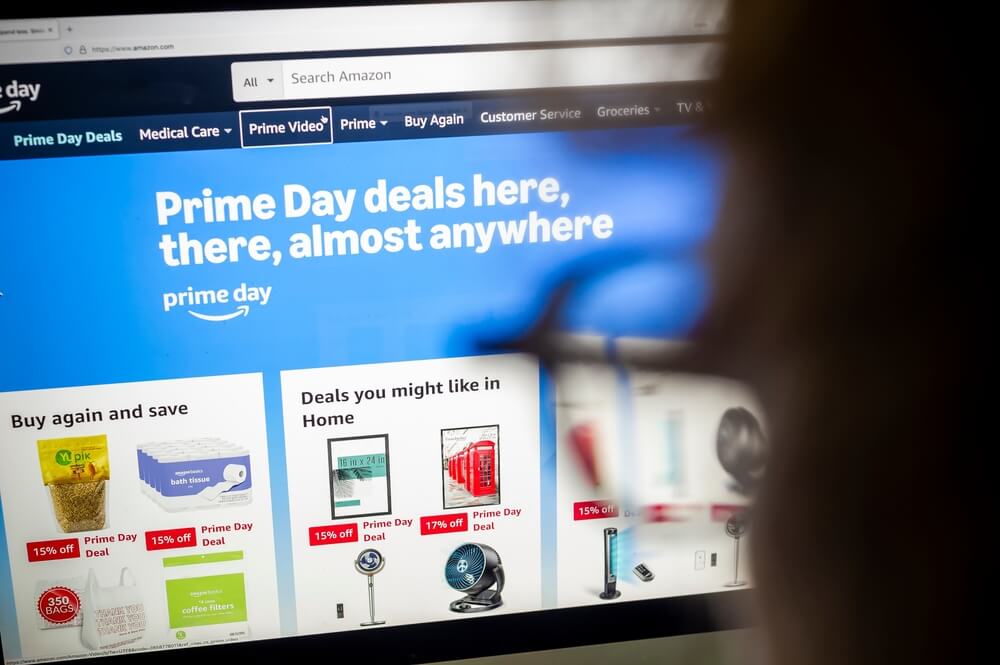
We’re in the middle of a shopper’s paradise as Amazon.com Inc. (AMZN) holds its annual Prime Day sales event.
For the first time since its inception in 2015, this year’s Prime Day event will span four days (up from two days). The sitewide sale started yesterday and carries on through Friday.
Everyone is now trying to get in on the action, with other massive retailers such as Walmart and Target offering similar sales or price matching what they have on offer.
Perusing through these deals got me thinking about a wide range of things … from broader consumer confidence to Amazon’s stock.
All things I’m going to go over today.
Let’s get after it.
Prime Day Comes Amid Slumping Consumer Sentiment
Every month, The Conference Board’s Consumer Confidence Survey examines consumer attitudes, buying intentions and expectations for inflation, stock prices and interest rates.
It is an all-encompassing look inside the mind of the American consumer.
An index reading of 100 is the benchmark. Anything above signals strong consumer confidence, while any reading below indicates weaker consumer confidence.
Consumer Confidence Falls in June
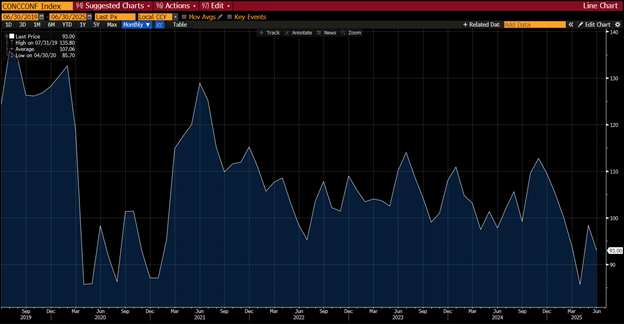
In April of this year, the survey bottomed at 86 before rebounding to 98 in May.
While the jump didn’t put the survey at the benchmark, retailers were encouraged to see that consumers were feeling more confident about the state of the economy.
However, last month the survey deteriorated by five points to 93 … not horrible, but a sign that confidence was weakening again.
This led me to a question … Does sagging consumer confidence concern Amazon in the midst of the biggest sale of the year?
Expectations for Prime Day … and Amazon (AMZN) Stock
In short, the answer to my question above is likely … no.
The reason is that no matter what the economic condition is, or the consumer sentiment, Prime Day sales have consistently risen since 2016:
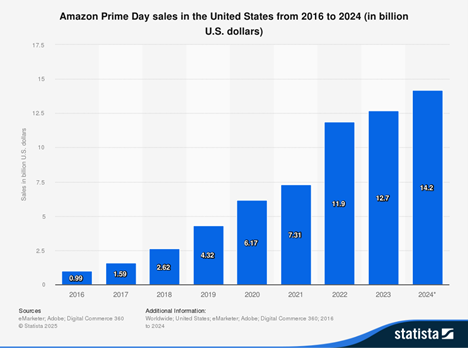
Prime Day sales have gone from just under $1 billion in 2016 to $14.2 billion last year.
Part of that increase can be attributed to Amazon extending its sale to two days in 2017, but still, that’s a massive jump in less than a decade.
Adobe is forecasting a record $23.8 billion in sales from Prime Day this year — a 28.4% jump from last year’s record.
In addition to a now four-day sale, back-to-school shopping and “buy now, pay later” options should be significant drivers, as budget-conscious consumers look for flexibility to manage spending.
So, while I don’t believe there will be a negative impact on Amazon’s sales, even with consumer sentiment on the decline, I was also curious about how Amazon’s stock performed before and after its Prime Day extravaganza.
For this, we can look at how AMZN has performed over specific timeframes before, during and after Prime Day since 2015.
Bespoke Investment Group found that on average, AMZN advanced 1.7% a week after Prime Day. That average jumped to 4.2% in the month, and the stock climbed an average of 5.5% six months after the site-wide sale.
You know the old saying that past performance does not indicate future results, but it’s hard not to see the trend of Amazon stock growing in the weeks and months following Prime Day.
We can always use our Green Zone Power Rating system to gauge where Amazon stock is currently…
Amazon Stock Green Zone Power Ratings: Strong Growth, Struggling Momentum
Amazon stock scores a “Bearish” 40 out of 100 on our six-factor system:
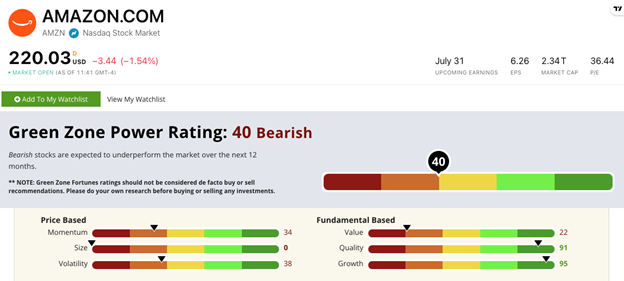
AMZN Green Zone Power Ratings in July 2025.
AMZN scores in the green on both Quality (91) and Growth (95).
That isn’t surprising if you take into account just the sales growth shown above from Prime Day.
Amazon’s gross, net and operating margins are well above the averages of the general merchandise retail industry.
AMZN struggles on Value (22) — with a price-to-earnings ratio of 36.5x — Momentum (34) and Volatility (38).
This is due mainly to the peaks and valleys that the stock, and the broader retail market, have encountered over the last 12 months:
AMZN Up Just 10.5% in 12 Months
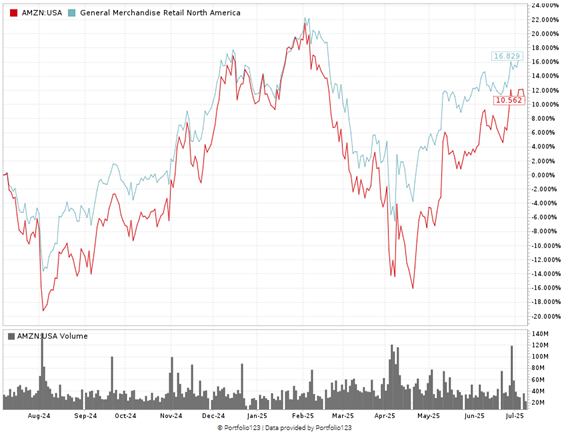
AMZN bounced between a low of around $160 in August 2024 and a high of more than $240 six months later.
The stock is still rebounding from April’s hit following President Trump’s reciprocal tariff announcement.
All told, the stock is up 10.5% in the last 12 months while its industry peers are averaging a 16.8% gain.
Overall, Prime Day will likely be another boon to Amazon’s bottom line. That could translate to its stock climbing close to its 52-week high in the coming months.
However, our Green Zone Power Rating system points to bearish underperformance compared to the broader S&P 500 from here.
That’s all from me today.
Safe trading,

Matt Clark, CMSA®
Chief Research Analyst, Money & Markets