Can Santa save the markets?
Nothing else really seems to be working so unless President Donald Trump delivers a Christmas miracle in the form of a new trade deal with China, the stock market could continue free-falling through the Christmas season into the new year.
But using history as an indicator, there is no Santa sleigh bells rally. In fact, the weeks leading up to Christmas are no more likely to rally than any other time of the year.
Per MarketWatch:
To be sure, hardly any of the many advisers and commentators who base their hopes on a Santa Claus Rally ever bother to define exactly when it begins and ends. But, according to Google Trends, references to it begin to pick up every year around Thanksgiving and reach a peak around Christmas. So, for purposes of subjecting the Santa Claus Rally to statistical scrutiny, I am measuring it as the gain from where the stock market closes on the Wednesday prior to Thanksgiving to its highest close between then and the end of December.
To illustrate, consider last year. The Dow closed at 23,516.18 on the Wednesday before Thanksgiving, and between then and the end of 2017 its highest close was 24,837.51 — 5.6% higher. That represents the maximum rally potential for the Santa Claus Rally period for a trader with perfect timing.
A 5.6% one-month gain certainly appears mouthwatering. But how does it compare to the other months’ rally potential?
To find out, I calculated a comparable gain for each other month. Specifically, for each month I measured the Dow’s gain from its fourth Thursday (analogous to Thanksgiving) to its highest close in the subsequent month. Each month’s average since 1896 (when the Dow was created) is plotted in the accompanying chart.
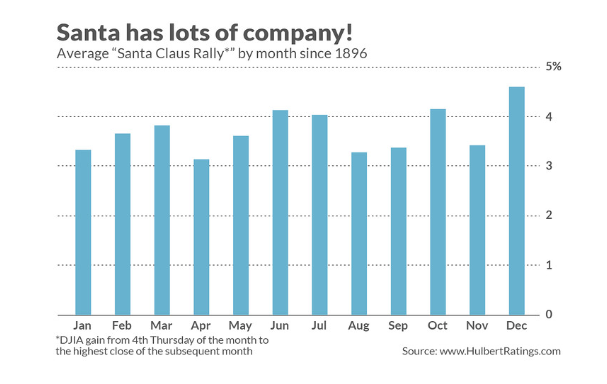
So using history’s example, there is nothing particularly special about the period that began this week up to Christmas with an average rally potential of 3.42 percent — which actually is below average. There are at least seven other months with higher rally potential. The average rally potential for every month other than December is 3.74 percent, .3 percentage points higher.
Note carefully that none of the differences in the chart is significant at the 95% confidence level that statisticians often use when assessing whether a pattern is genuine. So you shouldn’t conclude from the chart that there is now a reason to avoid the Santa Claus Rally period.