

We all have our childish fantasies.
When I was in college, I imagined Wall Street was a serious place where button-down men and women rolled up their sleeves and did the real work of running the world’s financial system.
Silly me. Imagine how disappointed I was to find it’s a gigantic frat house that dumbs down what should be important investment decisions into fortune cookie sayings.
“Don’t frown, average down!”
“The trend is your friend!”
And of course, the perennial: “Sell in May and go away.”
This last one is worth a little more consideration. All stupid nursery rhymes aside, it’s been proven that the market tends to perform better in the six months between November and April than during the six months between May and October. There are theories about why this is — such as Wall Street emptying out to the Hamptons during the summer months — but it also comes down to some of the biggest busts in history skewing September and October, such as the crashes in 1929, 1987 and 2008.
Whether there are legitimate “reasons” for all of this or whether it’s pure, random coincidence, we may never know. But just for grins, let’s take a deeper look at the “sell in May” data.
Sell in May and Go Away?
We’ll start with the frequency. Take a look at the number of positive months versus negative months going back to 1928.
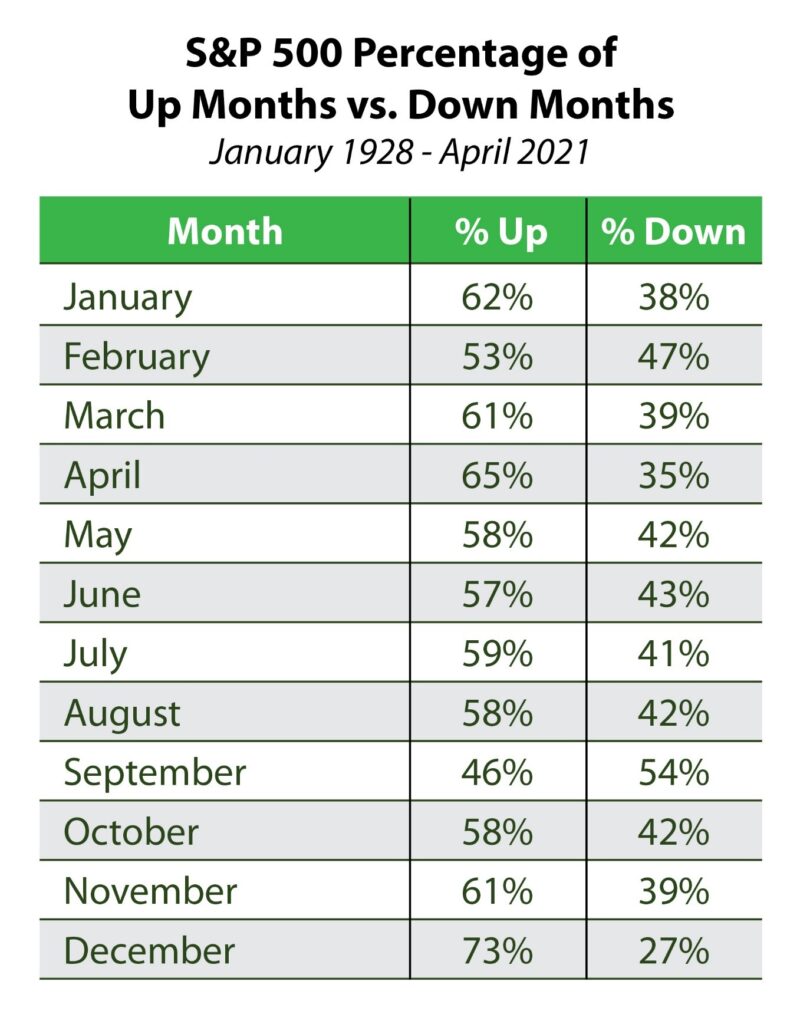
With the sole exception of September, every month has been positive more often than not by a wide margin. Playing the odds suggests that being out of the market between May and October would leave a lot of money on the table.
Of course, it’s not just the frequency that matters. Magnitude matters more. After all, it doesn’t do you a lot of good to score a hundred 5% gains in a row only to lose them all in a single 95% drop. In most months, the average loss is larger than the average gain. To pick on the “sell in May” myth, the average gain when May is positive was 3.2%. But the average loss was 4.7%.
That’s interesting, but an extra percent and a half isn’t life-changing. Just for grins, let’s see what the average monthly return, including both positive and negative months, is for the S&P 500.
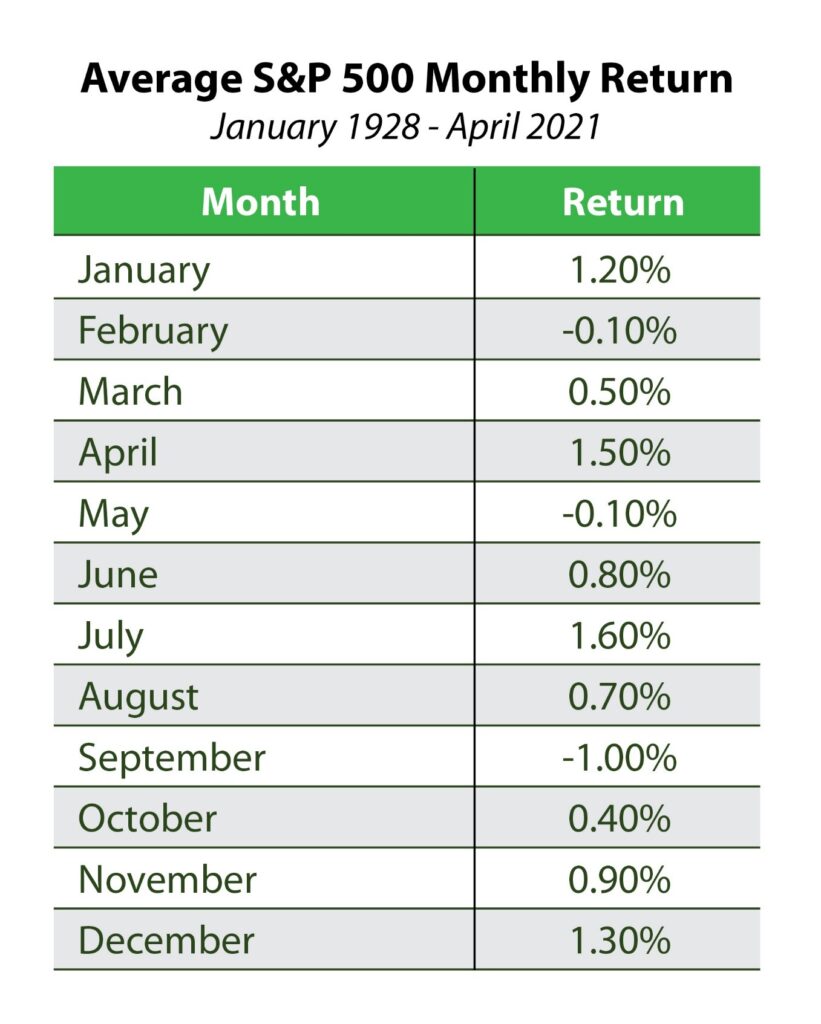
Here, the data tells a different story. Nine of the twelve months had gains. But February and May have had average losses of a modest 0.1%, and September had an average loss of a full 1%.
Again, September is somewhat skewed due to a handful of nasty historical crashes in that month. But the takeaway is the same. Yes, market returns are more muted in the May to October stretch. But summer returns haven’t been bad over the years. July is the best month on average, and June and August aren’t slouching either.
Months Might Not Matter
Let me be clear on one point: I’m not trying to convince you to buy, hold and forget about your investments. There are times when we should be heavy in stocks, and there are times we shouldn’t. But this has a lot more to do with market valuations and the prices of competing investments. The calendar effect, by itself, isn’t a justification for making major portfolio moves.
The biggest takeaway: We shouldn’t listen to simplistic Wall Street slogans like “Sell in May.”
Instead, if you’re interested in real technical analysis and taking a far more intelligent approach to seasonal trends, give Adam O’Dell’s Home Run Profits a look.
I recently sat down with Adam to talk about how it works. This system revolves around options, which get a bad rap for being “too risky.” But Adam’s research guides you through the world of options and how to manage that risk.
It’s worth mentioning that nobody else … no Wall Street firm, no institutional bank, no elite investor … nobody can take advantage of this strategy other than those in the Home Run Profits community.
And Adam’s patent-pending system is so powerful, he guarantees that you’ll average 100% gains every month.
So, click here to see how Adam’s Home Run Profits strategy works and how he made it so simple it only takes you 15 minutes a month to use.
To safe profits,

Charles Sizemore
Editor, Green Zone Fortunes
Charles Sizemore is the editor of Green Zone Fortunes and specializes in income and retirement topics. Charles is a regular on The Bull & The Bear podcast. He is also a frequent guest on CNBC, Bloomberg and Fox Business.