A sell-off has left the U.S. stock market on track for a three-day losing streak, posing the first big test for market bulls in 2019 says Mott Capital’s Michael Kramer.
Mott Capital’s Michael Kramer said Thursday’s trading action demonstrated the stock market’s resilience as major indexes managed to hold at or above key technical support, but a trade beneath those levels on Friday could be a sign that at least a short-term reversal may be at hand.
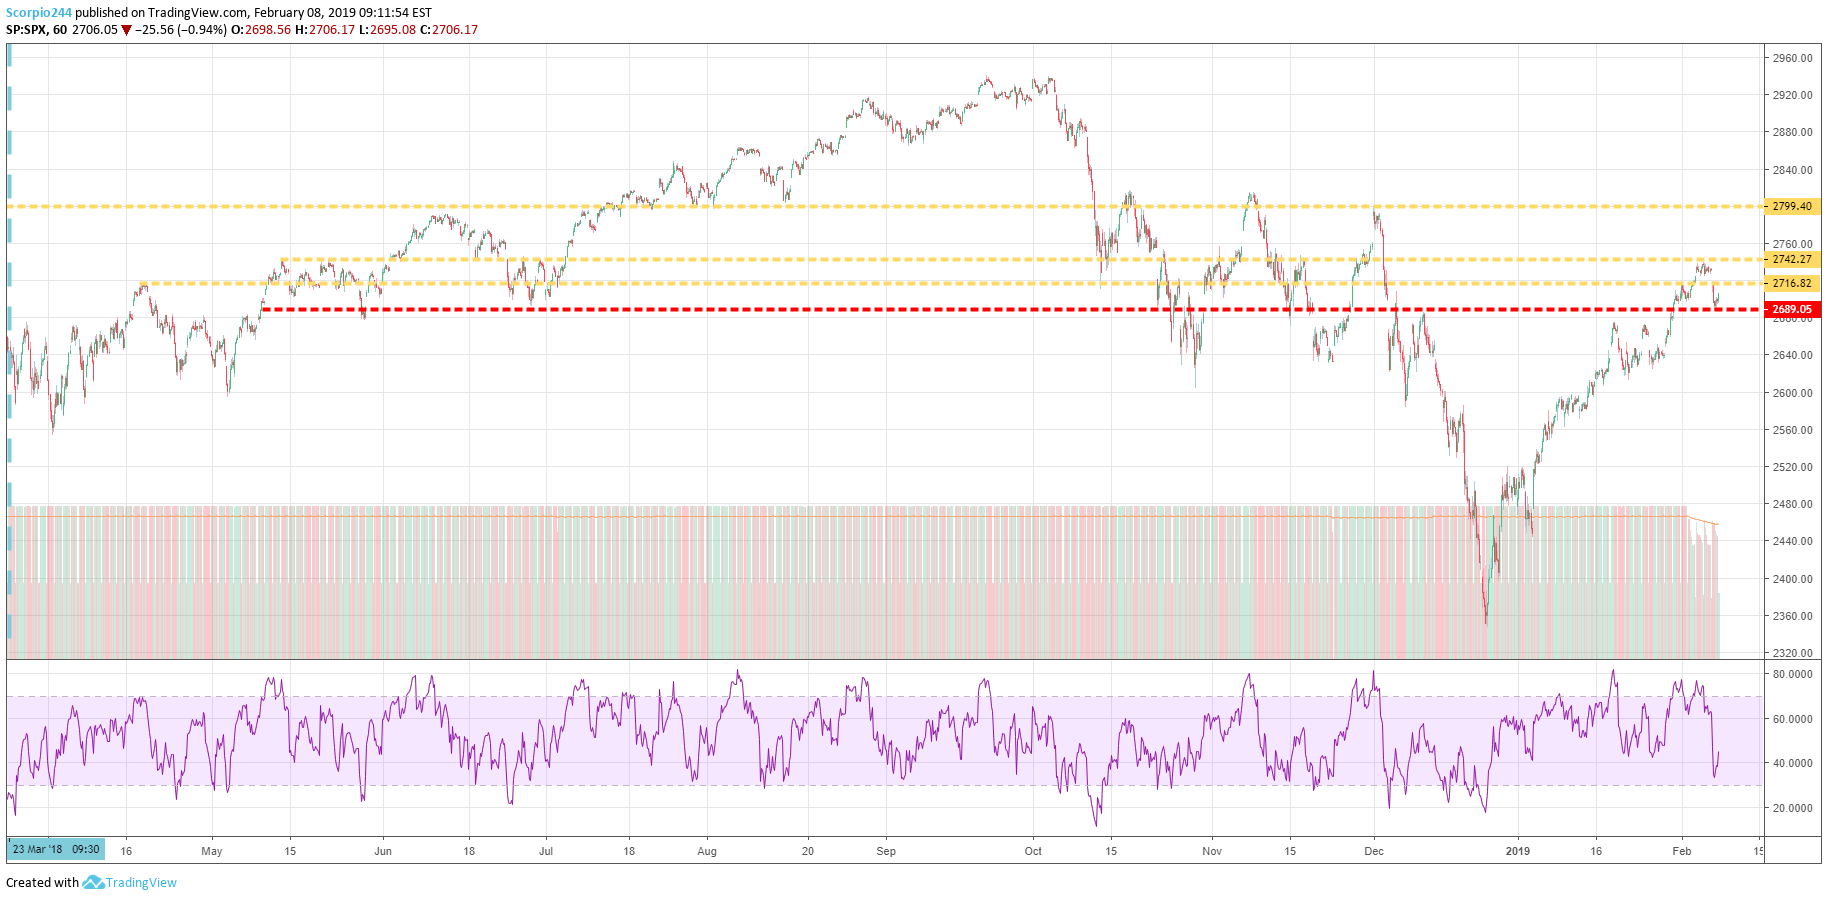
“Yesterday, many of the major indexes tested key levels of support and resistance, held firm and recovered from those losses. The S&P 500 has seen 2,690 act a major level of support and resistance on several occasions since May,” Kramer told MarketWatch in emailed comments.
The S&P 500 index SPX, -0.39% was trading right at around 2,690, down 0.6% for the day. Meanwhile, the Dow Jones Industrial Average DJIA, -0.66% was off nearly 200 points, or 0.8%, slipping back below 25,000, while the Nasdaq Composite Index COMP, -0.23% was off 0.6% at 7,247.
The S&P snapped a five-day winning streak on Wednesday and is on track for a 0.5% weekly decline. The S&P 500 is on track for a 0.5% weekly decline but remains up around 7.4% year to date and around 14.5% from its Christmas Eve low of 2,351.10.
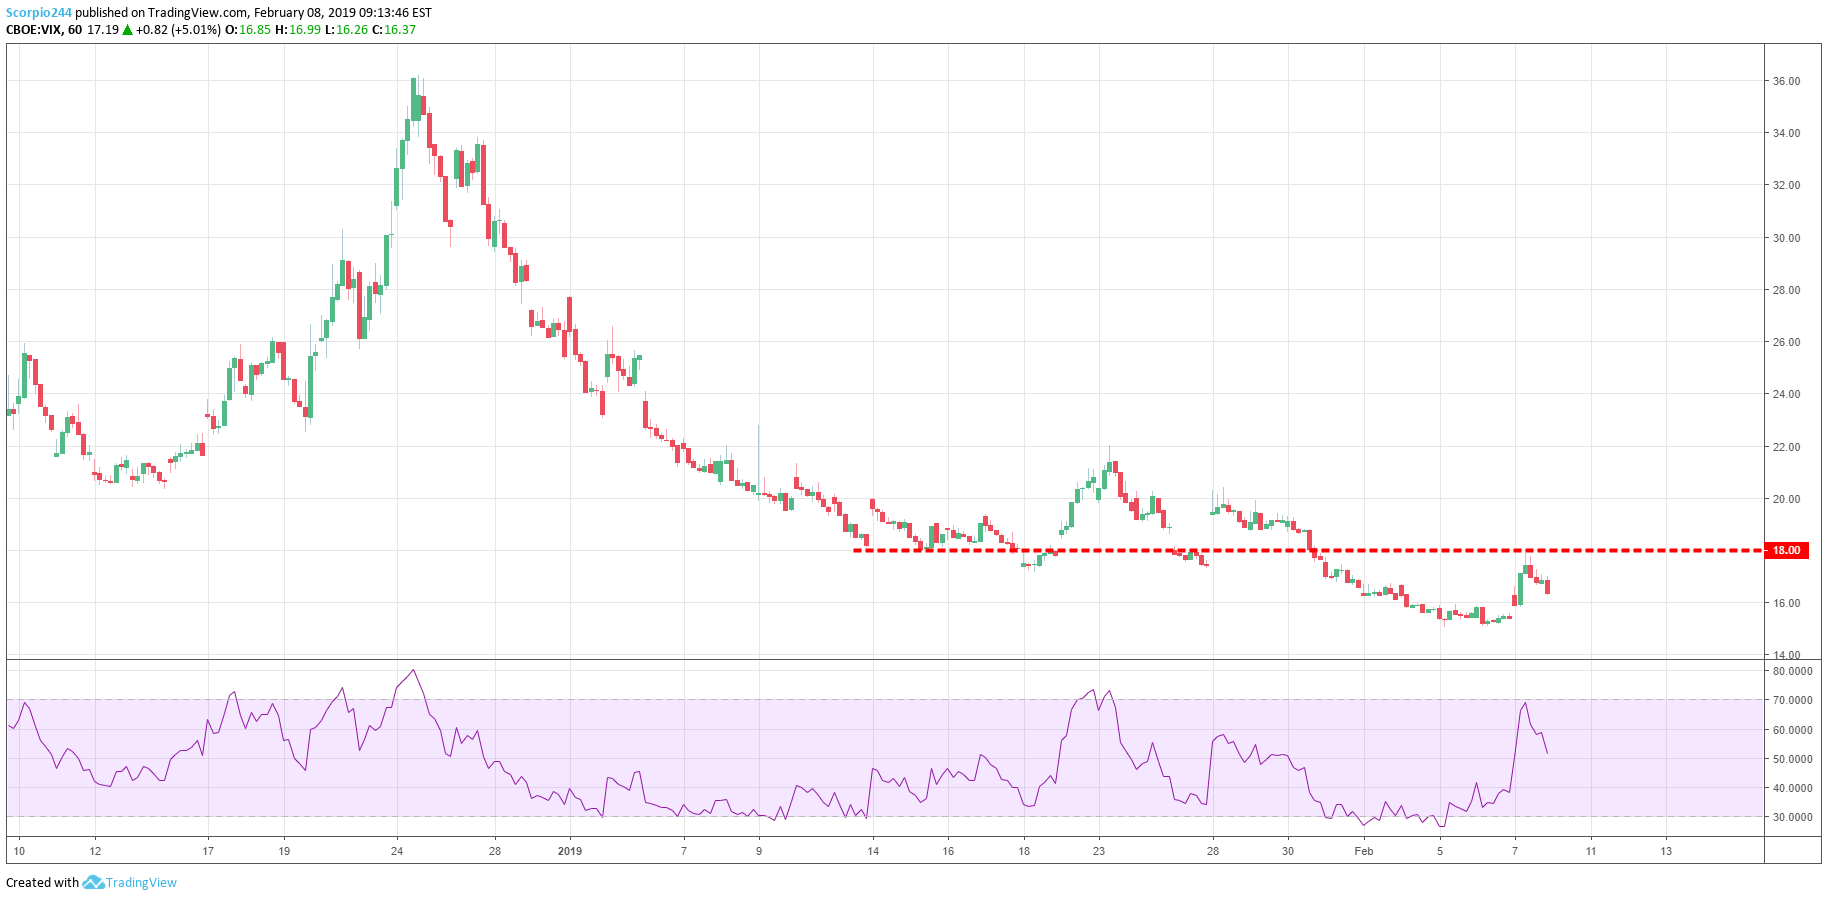
Kramer also says that the Cboe Volatility Index VIX, +1.41% or VIX, needs to hold below 18, a point that has represented a level of resistance for the gauge. The VIX, often referred to as Wall Street’s “fear gauge, traded at 17.38 on Friday. It measures trader expectations for volatility over the coming 30-day period and tends to rise as expectations for declines grow.
Again, all of these levels of support and resistance would at least suggest to me that sellers could not crack the market. If the market opens and tests these level again today and then holds, I think we are off to the races and on pace for 2,800,” Kramer wrote. That would represent a more than 4% gain for the S&P 500 from its current level.
But if market’s unravel on Friday — watch out.
A number of technical analysts have been pointing out that the S&P 500 has struggled to hold above its 200-day moving average. The average on Friday stood at 2,742.53, according to FactSet data. Market watchers use moving averages to help determine short-term and long-term trends.
The Nasdaq is trading well below its 200-day moving average of 7,457.37, while the Dow is below its 200-day average of 25,004, after cracking above that level earlier in the week.
Other technical analysts believe that recent declines point to the fragility of the recent run-up and the possibility of an unwind to take shape.
“The reversal flavor is clear enough,” wrote Ken Odeluga, a market analyst at City Index in London, in a Friday note.
“Buyers should now be on tenterhooks that the complex could soon give way. If so, it would break below a triangular structure at its apex with some force. Kickbacks within 24,200-24,080 over the last few months could subsequently come into play,” he wrote, referring to the Dow.
A combination of fear that a trade resolution between the U.S. and China won’t be reached soon and growing signs of sluggish economic expansion outside of the U.S. is part of the narrative that has underpinned the recent spate of declines, after the S&P 500 enjoyed the best January performance since 1987.
We arm Main Street investors with Wall Street tools to help them make money in any market. Sign up for FREE access to our Money & Markets Daily emails and take control of your Money!
In his free newsletter, What My System Says Today, Adam O’Dell uses his Green Zone Power Rating system to keep you in the know and focused on the market’s best (and worst) opportunities. It’s a data-driven approach underpinned by Wall Street-caliber tools you can only get here at Money & Markets. Sign up for FREE access to our daily emails now!