March 2009 was the low point for the stock market amid the Great Recession. And while no one on Wall Street is celebrating this rather dubious anniversary, there is a lot to cheer about considering how far back things have come.
The Great Recession was the worst economic shock the U.S. had faced in some 75 years, pushing central banks around the world to usher in the most aggressive stimulus ever seen. Zero and even negative interest rates and quantitative easing were the new norm, as trillions of dollars worth of bonds were gobbled up by banks like the U.S. Federal Reserve.
Per CNBC:
Since the S&P 500 sank briefly to 666 on March 6, 2009, and reached its closing low of 676 three days later, the index has delivered a 10-year annualized total return of 17.8 percent.
This neatly matches the annual gains (including dividends) posted by the S&P exactly 10 years after the October 1987 market crash (17.2 percent), and after the August 1982 bottom (17.6 percent), when the greatest modern bull market began. Even 10 years after the brutal bear-market trough of September 1974, the returns match up well: up 15.6 percent annualized through September 1984.
This chart, put together by Michael Batnick of Ritholtz Wealth Management, tracks the rolling 10-year trailing returns for U.S. stocks since 1935. A horizontal line drawn back in time from the current level (15-18 percent) would intersect with several of those moments 10 years after a brutal market washout, including in the mid-1950s.
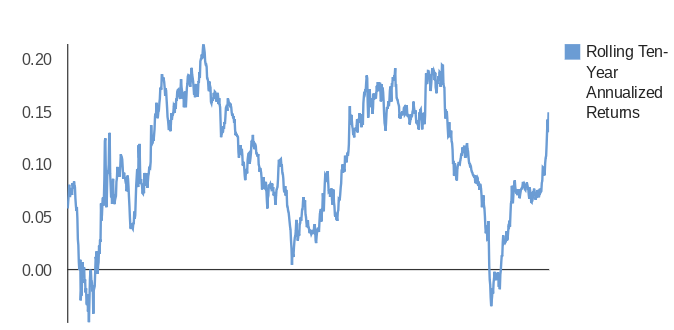
A few observations can be taken from this long-term view of how the market runs through alternating generous and stingy phases.
Staying or getting invested when stocks have been most disappointing and investors are questioning the long-term wisdom of equities (this happened in the late-’70s/early-’80s and after the 2008 crisis) has been rewarded with returns roughly 1½ times as good as the long-term average.
Not the end of the bull
When the trailing 10-year return gets up to this area, it typically means a bull cycle is far along, but hasn’t generally marked its end. If one had bought the S&P 500 when the trailing return was near its current level in 1984, 1992 or 1997, there was a bit of time before major declines — up to three years. Though the forward 10-year returns from those entry points were lower, they were positive — 7 to 14 percent a year.
Keep in mind, this trailing return will start to be weighed down simply by arithmetic, as we move ahead in time and the dramatic March 2009 low exits the 10-year return window, replaced by higher index readings as a starting point.
This broad perspective also sets aside the interesting but ultimately unimportant debate over whether this has been one continuous bull market starting at the March 2009 low, or a series of bull and bear phases. Some commentators insist that the snapback from the ’09 depths to the former 2007 high — which took until early 2013 — was the final act of the prior bear market that started in 2000.
Others view the near-20 percent drops in the S&P 500 in 2011 and late last year as cyclical bear markets that reset the clock to a new bull market. But for the typical investor’s experience, the score that matters is the appreciation over an extended period. Right now, this tally shows that the market doesn’t owe investors much in coming years, but frequently does deliver more upside before the tide reverses for real.
This is where the objections will come, arguing somehow that the past decade simply cannot be credibly compared to earlier periods. “It was all central banks,” they’ll say — which was also said in the ’80s and ’90s. (Also, the federal funds rate near 2.5 percent today is exactly where is stood in the “good old” 1950s.)
“But growth has been anemic,” many will argue. True, relative to the boom-bust postwar norm. But the ’90s were also denigrated as showing slow growth over a prolonged cycle, until near the decade’s end.
No matter the cadence of the economy or stance of policymakers, the market metabolizes it all by breaking the world down into corporate profitability, the cost of money and crowd psychology.
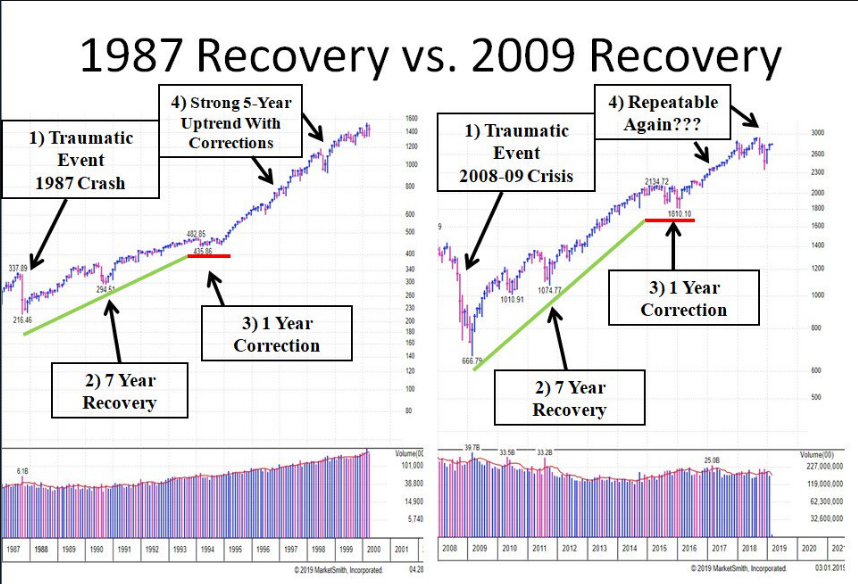
Comparisons to 1987
Joseph Fahmy of Zor Capital, has for a few years now been treating the 2009 market low as analogous to the 1987 crash. Yes, of course, the ’87 crash did not happen during a recession and its broader economic impact was limited, unlike the 2007-’09 meltdown.
But as a traumatic market break that punctuated an investing era, he sees it as a useful analogy.
Fahmy considers the fourth-quarter crunch as “similar to the summer of 1998, a three-four month quick correction before heading higher.”
So far, the market is cooperating with this view, having recovered all but about 4 percent of the late-2018 losses in a steady ten-week march higher.
Sentiment still poor
Unless and until the S&P retakes its former high, some cautious observers will argue that nothing that’s happened in recent months is necessarily inconsistent with September’s high marking the ultimate bull-market peak, with the recent upswing a reflex bounce in a budding bear market.
But one interesting feature of the present rally is how relatively reluctant many professional and individual investors have been to embrace it (as gauged by sentiment surveys, fund flows and hedge-fund positioning).
Perhaps this is the muscle memory of the last crash still governing the actions and impulses of investors — many of whom have enjoyed a 16 percent annual return for a decade but have a hard time believing the market has much more left to offer.