
I consider myself a market historian, and experience has taught me that looking to the past for clues is helpful for keeping current turmoil in perspective.
As Mark Twain is alleged to have said: “History never quite repeats itself, but it rhymes.”
The closest “rhyme” today would be the nasty bear market that kicked off in 1973 and ran well into the next year.
Then, as now, the market was coming off of a long bull market centered on the growth and tech stocks of the day.
Like today, inflation was a major issue. And it was exacerbated by Federal Reserve policy mistakes and supply shocks.
In 1973, it was the oil embargo against the West. In 2022, it’s the aftereffects of a global pandemic and the war in Ukraine.
Of course, a similar situation does not mean the same situation.
One of the biggest differences between the 1973 bear market and today is that, at least in the ‘70s, you could make a killing in gold, commodities and other real assets.
Today, it seems there is nowhere to hide:
- Stocks, bonds and gold are all down.
- Real estate is looking wobbly.
- Even crude oil, which was a standout in the first half of the year, has been in a steep decline since June.
So what conclusions can we draw from this?
How the Fed Inflated the “Everything” Market Bubble
To start, we should remember that we had an “everything” market bubble due in large part to the Fed’s aggressive quantitative easing of the post-2008 era that kicked into high gear for the two years between March 2020 and March 2022.
The Fed’s balance sheet more than doubled from about $900 billion in the third quarter of 2008 to $2.2 trillion by the end of that year. It then doubled again to about $4.5 trillion by 2014 before declining to $3.7 trillion in 2019.
Then things got stupid.
The Fed’s Balance Sheet Bubble
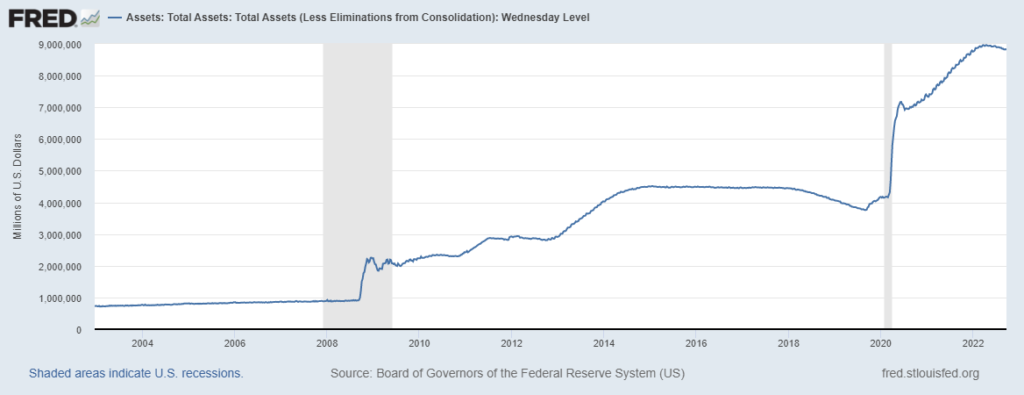
Source: The Federal Reserve.
The Fed gobbled up $120 billion in bonds per month throughout most of the pandemic, inflating the balance sheet to just shy of $9 trillion earlier this year.
The central bank slowed its bond buying in January and halted it altogether by March. The market has been a train wreck ever since.
Cash is called “liquidity” for a reason. It sloshes through the financial system and the economy.
I’ve talked about how a rising tide lifts all boats.
Well, the introduction of trillions of dollars of liquidity had the effect of inflating the prices of everything. Stocks, bonds, commodities, real estate, art, cryptocurrencies … the list goes on.
And now we’re seeing the effects of that liquidity draining away.
The tide is going out, and the water level is falling.
What’s Next for the Market Bubble?
My biggest takeaway from the early ‘70s experience is this: Draining liquidity out of the system is slow … and painful.
That bear market lasted 630 days — almost two full years. And when it was over, the S&P 500 had lost 48% of its value.
Now, I’m not saying I expect our current bear market to drag on for two years or to drop another 25%.
Maybe it does, maybe it doesn’t. We’ll explore those possibilities in the coming weeks here in the Money & Markets Daily.
But what we are experiencing is more than a garden-variety cyclical bear. Messes like these take longer to clean up.
It’s also worth noting that the post-bear recovery in 1974 was slow and uneven following the collapse.
We’re used to buying dips and expecting a quick bounce. That was the case following the 2000 and 2008 crashes and the flash crash that occurred in 2020.
It took nine years for the S&P 500 to reach and stay above its old 1973 highs. Adjusted for inflation, the S&P 500 didn’t recoup its losses until 1991, almost 20 years later.
What do we do with this information?
I have two suggestions.
1. Be willing to take an active approach in your trading.
While the market was a smoldering dumpster fire for most of the 1970s, there were plenty of opportunities for short-term trades.
You don’t have to care if “the market” is trending higher or lower if you’re able to take short-term profits along the way.
My colleague and Green Zone Fortunes Co-Editor Adam O’Dell has a knack for spotting these opportunities. He’ll dive into how he uses the value factor in tandem with five other metrics within his proprietary Stock Power Ratings system to find them in tomorrow’s Money & Markets Daily.
2. Make income a priority.
One of my favorite long-term strategies is to dollar-cost average via dividend reinvestment. I buy a stable dividend stock, instruct the broker to automatically reinvest the dividend in new shares and then sit back and let compounding do the rest.
If you’re looking for a good candidate, consider National Retail Properties (NYSE: NNN).
I wrote about NNN way back in 2020, and the stock yields more than 5% at today’s prices. It rates a “Neutral” 53 out of 100 on our Stock Power Ratings system, but it scores well where it matters:
- 86 on momentum.
- 61 on volatility.
In other words, this is a low-volatility business that has been trending higher relative to the market. Shares are lower of late due to rising bond yields, but if you’re looking for a solid worry-free dividend compounder while the market bubble deflates, I can think of few better.
To safe profits,

Charles Sizemore, Co-Editor, Green Zone Fortunes
Charles Sizemore is the co-editor of Green Zone Fortunes and specializes in income and retirement topics. He is also a frequent guest on CNBC, Bloomberg and Fox Business.