

Chad Shoop
Editor, True Options Masters
I’ve been at Banyan Hill for nearly a decade now and have had my fair share of success helping everyday people trade options.
One of my strategies, a method of drawing consistent income out of the options market, has won on more than 90% of its trades…
Another, a more speculative options trading strategy focusing on earnings reports, averages 12 triple-digit gains per year…
But I can confidently say, my new options-trading strategy is unlike anything I’ve done before.
It’s called the “Profit Radar.” And it’ll change the way you look at the market forever.
Order out of Chaos
To an everyday investor, the movements of the stock market might look like nonsense. The market’s up one day, down the next, with the mainstream media always at the ready to conjure up the reason.
Sometimes the market is up, but your portfolio is down! How does that happen?
But stock movements aren’t nearly as chaotic as they might seem.
The reality is, market sectors all go through a natural rotation: from leading the market to weakening, then from lagging it to improving, and then the cycle repeats.
It isn’t always so direct, of course. Sometimes sectors will spend time leading the market and then go straight back into weakening before lagging it. But generally, all assets follow this cycle.
Once I understood this natural dynamic, I knew there had to be a way to show it.
So for the past couple of years, I’ve been working on a new technique that shows us which market sector is about to improve against the broad market or begin to lag.
For that, I use a specially tuned version of the Relative Rotation Graph (RRG), which tracks assets as they go through this cycle.
By studying the RRG and experimenting with its variables, I’ve turned it into a Profit Radar.
And with this radar, I can pinpoint the sectors and stocks primed for a move higher — and then jump in to capture rapid profits.
There’s a metaphor I like to use when explaining this strategy.
Let’s say the stock market’s a highway. Depending on the lane (index) you’re in, you have cars (stocks) moving at different speeds.
Some lanes are stuck in traffic — the cars are crawling along.
But other lanes are clear… allowing the fastest cars to blow past the speed limit.
We want to be in those cars — the fastest cars in the fast lane. That’s where the biggest gains, with the surest setups, lie.
Let me show you an example. This is what my Profit Radar showed back on August 3, 2021.
Here I’m comparing the five major U.S. stock market indexes — the Dow (DIA), the S&P 500 (SPY), the Russell 2000 (IWM), the mid-cap index (IJH), and tech stocks (QQQ) — with a global market index.
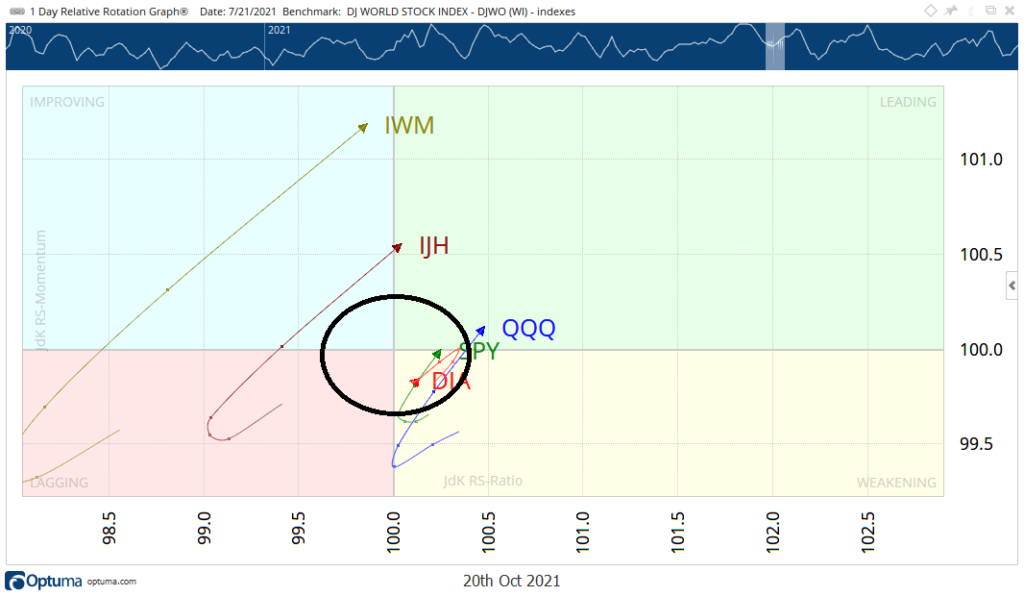
With a chart like this, I’ve learned where the slow lane and fast lanes are. If an index is within that black circle, consider it in the slow lane and trending right along with the global index.
Once it gets beyond that, that’s the moment it enters the fast lane.
You can see the QQQ just crossed past that black circle and is pushing higher in the leading quadrant. That tells me the QQQ is entering the fast lane.
But, we can also take it one step further. Instead of just focusing on a large index like QQQ, we can look at the fastest-moving stock inside the fastest-moving index…
Here’s what that looks like…
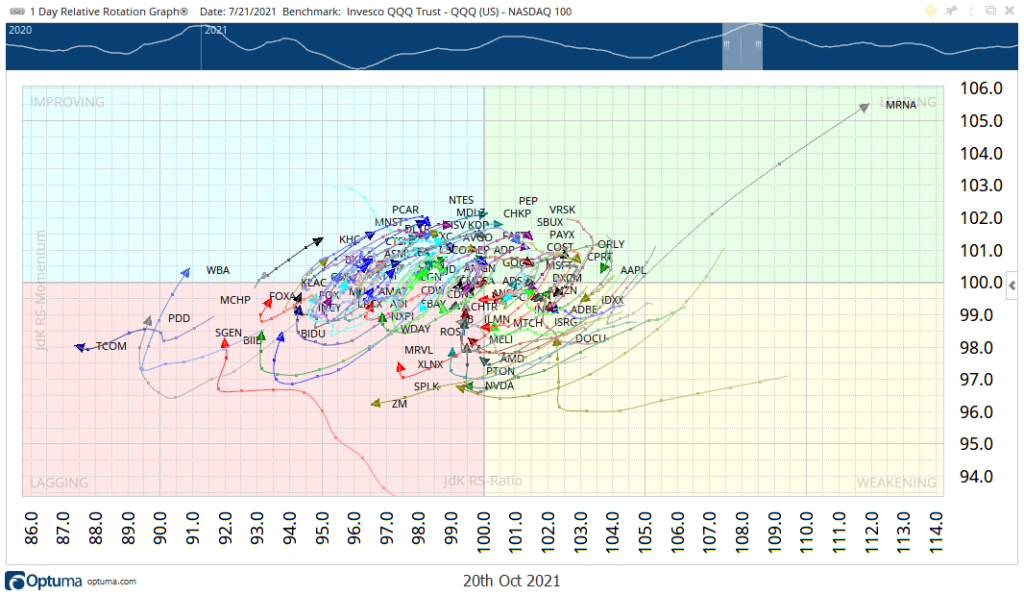
There’s a lot going on in this chart — it’s showing all the stocks that make up QQQ, and where they land on the Profit Radar.
From this level, it’s hard to tell which stock may be moving the fastest. But I know exactly where to look.
How to Get Your Portfolio Into the “Fast Lane”
See, the fastest moves come as a stock transitions from lagging the market to leading it. That swing, from underperformance to outperformance, gives us a clear path to spotting stocks making the fastest moves.
So I start there, looking at stocks that are making the swing from lagging the market, to improving. I don’t want to catch them once they are leading the market, because at that point, the fast part of their move is likely over.
We want to catch stocks that are still in the middle of that rotation.
And back on July 21, the best-looking setup was Cisco Systems (Nasdaq: CSCO).
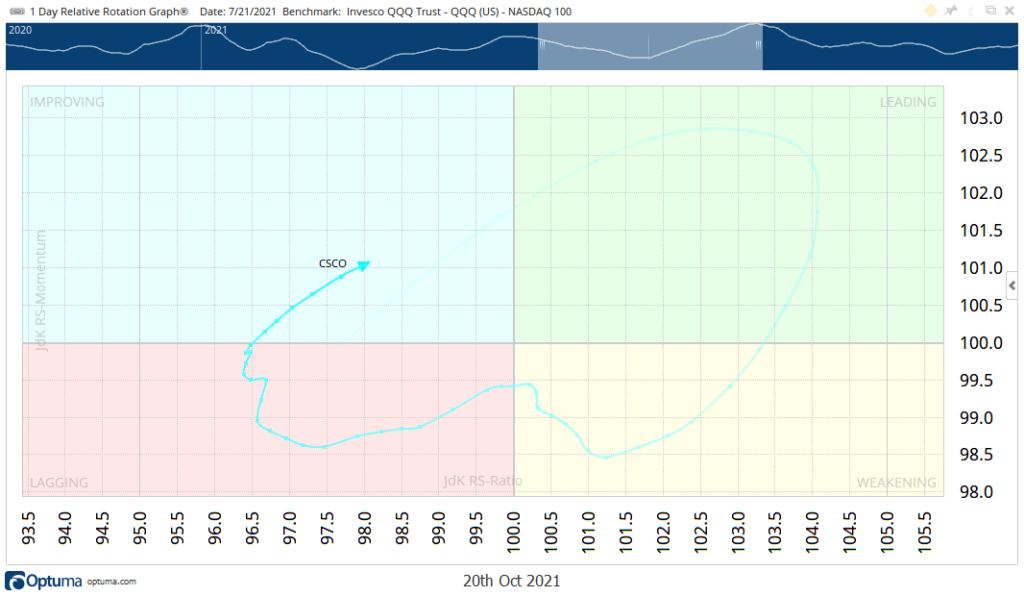
Back then, I saw that CSCO had exited the “lagging” quadrant, entered “improving” and was heading toward “leading.” It was also far away from the center — a sign it was going to be a fast mover.
So I recommended a trade to my subscribers on CSCO the following day…
In the days that followed, the stock jumped nearly 2%.
But the trade I recommended to my subscribers was up 159%. (I’ll show you how in just a bit.)
Here’s another example. On August 5, my Profit Radar signaled that traffic was clearing in small-cap stocks. The index was breaking out of that circled area on the RRG and entering the Fast Lane.
Within that sector, 3D Systems (DDD) caught my eye. Not only was it showing improvement… The company had an earnings announcement coming up, too.
It was a fast car in a fast lane if I ever saw one…
I immediately told subscribers to place a trade on DDD.
And in the next five days, DDD went up 42%.
But we exited with a 270% gain.
How?
Options Are a Money Multiplier
Because we used options, our gains were over 6x bigger on the DDD trade. And nearly 80x bigger on the CSCO trade.
I know that many traders shy away from trading options. They think they’re dangerous and only for seasoned traders.
And that’s a shame because options are actually the best way to build up a small trading account.
Options allow you to multiply small percentage moves … and to clearly define your risk. With options, you’ll never lose more than you put into any given trade.
And with options, we can profit off struggling areas of the market, too. My Profit Radar doesn’t only spot bullish opportunities, after all — it also tells me when a sector is starting to weaken.
In fact, trading puts on those stocks and indexes has led to some of our biggest gains, including 246% in one day and 52% in just hours.
With my Profit Radar, we have a tool that positions us for the best possible gains regardless of the market’s general direction.
And when you use this tool with options, it’s a borderline cheat code…
The simple fact is, this strategy outperformed the Dow by more than 3x during one of the most bullish four-year periods in stock market history. That’s counting all the wins AND all the losses.
And it did that without options.
When you add the power of options in, we were able to generate returns as much as 10x the move of the Dow.
This just wouldn’t have been possible without options.
My Full Fast Lane Strategy
I understand if you’re still skeptical — especially if this approach to making money in the markets is new to you.
That’s why my team and I created a detailed presentation showing all my findings using this strategy over the years.
At the end of this video, you’ll have proof that my Profit Radar is the best way to stay in the stock market’s fast lane.
Regards,

Chad Shoop
Editor, Quick Hit Profits