
Earlier this week, I wrote about and prepared a video about seasonality and the best six months of the stock market. Stocks tend to deliver strong gains in the six months starting November 1. This is a well-known seasonal tendency.
Less well-known is the best three months of the market. That’s the last three months of the year.
It’s widely known that the fourth quarter is the best quarter of the year. The SPDR S&P 500 ETF (NYSE: SPY) ends the year with a gain 83% of the time. The next best is the second quarter, where the three months (from April to June) have a win rate of 78%.
Calendar quarters are an easy way to look at the best three months. A more detailed look measures every three-month period. For example, we look at February through April and March through May. The results of this analysis of SPY from its inception 30 years ago are shown below.
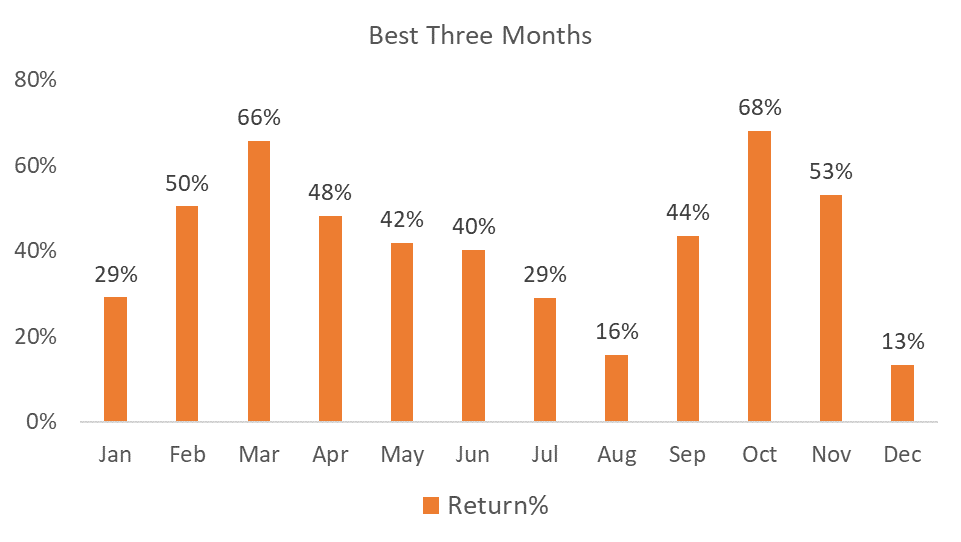
We’re now in the best three months of the year. March to May runs a close second based on returns. But October trades deliver gains 85% of the time compared to March at 75%.
This year, the best three months are off to a rough start. Stocks sold off on speculation that the Federal Reserve would raise rates. Or maybe the sell-off was caused by higher oil prices. It could also be related to global events. Analysts blamed all this, and more, for the weakness.
However, we did have some good news in the sell-off, and it created a buying opportunity to benefit from the strong seasonal trend. With seasonals pointing to gains, it’s time for us to decide what to buy.
2 Trading Opportunities for the Best 3 Months
Stock markets around the world have been bullish at this time of the year. South Africa is among the most bullish.
Traders often say: “Bull markets climb a wall of worry.” If you believe that, then South Africa could be the best trade.
iShares MSCI South Africa ETF (NYSE: EZA) is off more than 11% year to date. The exchange-traded fund (ETF) is more than 40% below its 2017 all-time high.
Bearishness seems reasonable given the country’s unemployment rate of more than 30%. There are also rolling blackouts because its national energy company is collapsing after years of mismanagement and corruption. High debt levels make it difficult to see a way forward.
But seasonals are short-term trades. They tell us EZA should bounce over the next three months. Aggressive traders could enjoy substantial gains if stock prices climb the wall of worry.
A lower-risk strategy would be to stick with U.S. stocks. Mid caps have been the best performers in the best three months.
The iShares S&P Mid-Cap 400 Value ETF (NYSE: IJJ) delivered a gain 85% of the time. The average win was 9.8%.
In 20 years, there were three losses, all being significant. There was a 23% loss in 2008, a 15% in 2018 and a 7% loss in 2007.
Now, there are two ways to manage risk on a strategy that has consistent gains but also occasional large losses. You could use a 10% stop-loss. This is an order to close the trade if the price falls 10% from your entry price.
Of course, there are many other strong seasonal trends we can profit from.
In fact, after back testing a decade’s worth of data by analyzing over 7,000 simulated trades, and integrating an AI-powered program, I’ve created the Apex Profit Calendar. This AI-driven stock strategy minimizes risk and stacks gains by uncovering trades on stocks owned only during their peak profit seasons.
The signals from this crash-proof calendar have the power to deliver an annualized gain of 64%, compared to the 11% annualized gain of the market.
I’ll be revealing exactly how it works in my event this coming Tuesday, October 24, at 1 p.m. Eastern time. Sign up here to attend my presentation to learn how you can start using the calendar to guide your investments right away.
Until next time,

Mike Carr
Chief Market Technician