
Matt’s Note: Before Mike tells you about the biggest lie of value investing, I want to mention something…
Mike Carr has opened the doors to his latest and perhaps greatest trading strategy: the 9:46 Rule.
He’s pulled out all the stops this week to prove to you that short-term trading is not just a useful moneymaking tool … it’s essential to the market environment we’re in today.
And what’s really mind-blowing? It’s always been useful. Yes, even during the boom times when stocks went nowhere but up and buy-and-hold value investors were dancing in the streets.
Today, Mike exposes a hidden secret of these types of investors — they care about price more than they care to admit.
Read on to learn how, by following Mike’s ideas, you could’ve front-run none other than Warren Buffett…
The Big Lie of Value Investing
Outside looking in, value investors look like they have it pretty easy.
Companies issue new financial statements every three months. They shouldn’t need to do anything between those releases.
Yet … there’s more work at hand.
Valuation metrics change every day. The price-to-earnings (P/E) ratio, price-to-sales ratio or dividend yield (the dividend-to-price ratio) changes every day.
Obviously, it’s the price that drives the change. Still, they claim price action isn’t important.
That’s the domain of technical analysis. And as Warren Buffett supposedly said: “I realized that technical analysis didn’t work when I turned the chart upside down and didn’t get a different answer.”
Buffett is a smart man. But he’s wrong here.
Look at the two charts below. Which one is giving you the correct answer about how to invest?
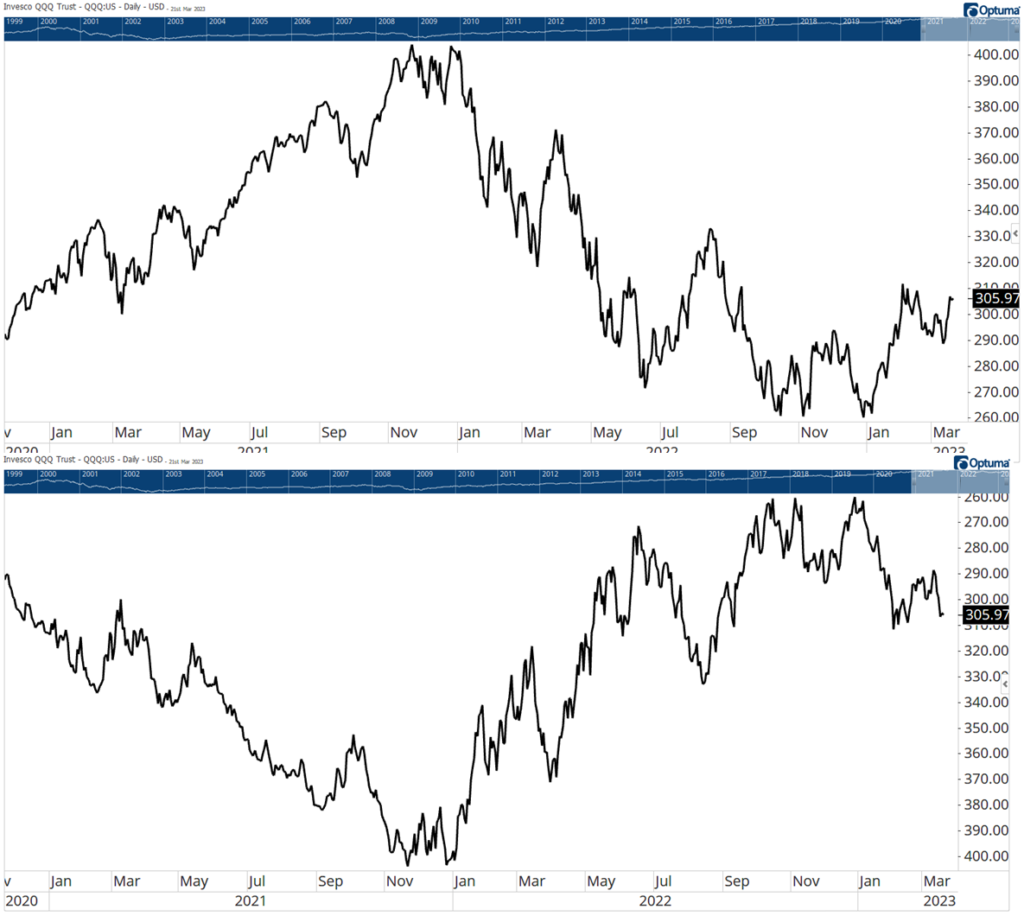
The one on top shows a downtrend. The one on the bottom shows an uptrend.
Both are charts of the Invesco QQQ Trust (Nasdaq: QQQ), which tracks the Nasdaq. So you don’t need me to tell which chart is correct.
If you act like Buffett and decide to follow the bottom chart anyway, you’d be buying into a downtrend. That’s never a good idea.
Clearly, Buffett is wrong here. Price does matter. That’s why he and other value investors look at it so much.
Value investors are actually focused more on the P than the E in the P/E ratio. They like to say they analyze the business. But ultimately, they always trade based on price.
That makes sense. If their analysis shows the business is worth $20 a share, they wouldn’t buy it at $20. They would want to buy lower.
In the end, they aren’t really buying businesses. They’re buying shares of stock. And this is where an analysis of the price action is most important.
The one on top shows a downtrend. The one on the bottom shows an uptrend.
Both are charts of QQQ, which tracks the Nasdaq. So you don’t need me to tell which chart is correct.
If you act like Buffett and decide to follow the bottom chart anyway, you’d be buying into a downtrend. That’s never a good idea.
Clearly, Buffett is wrong here. Price does matter. That’s why he and other value investors look at it so much.
Value investors are actually focused more on the P than the E in the P/E ratio. They like to say they analyze the business. But ultimately, they always trade based on price.
That makes sense. If their analysis shows the business is worth $20 a share, they wouldn’t buy it at $20. They would want to buy lower.
In the end, they aren’t really buying businesses. They’re buying shares of stock. And this is where an analysis of the price action is most important.
Front-Running Buffett
Let’s say you found a business worth $20 a share. The stock is at $6. You have the chance to make 233% if you’re right.
For this discussion, we’ll assume you’re right. This is a massively undervalued stock.
The problem is the stock might stay undervalued. There’s no guarantee that enough investors will agree with you and buy the stock to make it go up.
That’s why so many stock pickers give interviews to CNBC. They need other people to buy.
Stocks only move up when other people buy it. Stock prices fall when sellers act with a sense of urgency. If no one buys or sells the stock, it doesn’t move.
That’s not a problem for Buffett. Because when he announces a new buy, other investors buy.
Buffett’s track record leads others to assume he knows something they don’t. The chart of Louisiana-Pacific Corporation (NYSE: LPX) is a good example.
Buffett’s company Berkshire Hathaway (NYSE: BRK.A) announced its position in November 2022. We know he was buying in the weeks before that announcement because regulations require the timely disclosure of actions by large investors.
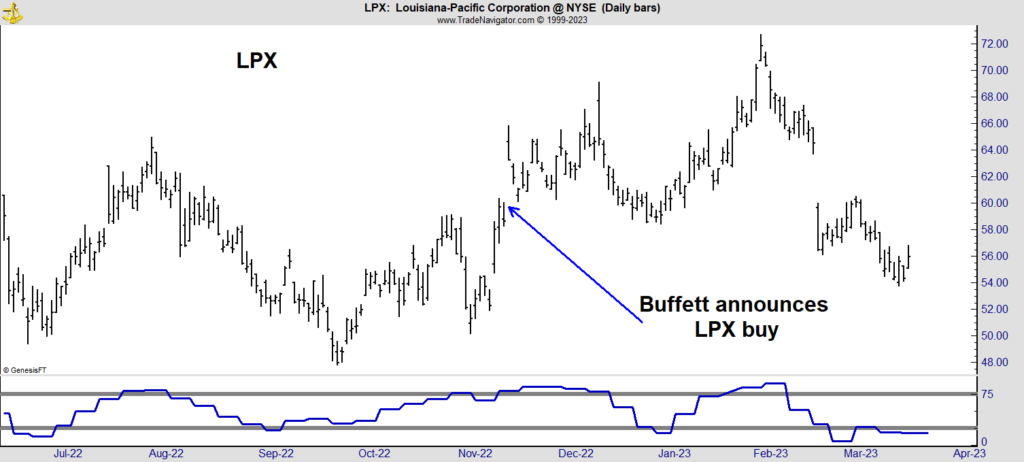
At the bottom of that chart is an indicator I designed to identify the buying and selling of large investors. It began rising in September 2022 and dipped right before Buffett’s announcement.
In hindsight, we knew the indicator was rising because Buffett was buying.
This chart shows the real problem with technical analysis. It takes skill to analyze charts. It requires indicators that aren’t widely available. Often, it requires indicators that you have to build yourself.
We can’t follow Buffett’s moves with moving averages, MACD or other tools available for free on dozens of websites.
But we can follow them if we dive deeper — to a level most value investors don’t even know exists.
We look at several different tools in my trade room every morning that have proven to work well. Among them, of course, is my “9:46 Rule.”
I’ve been developing this new system with my subscribers for the past several months, placing trades with my own money, and the results have been more than promising.
Fifteen minutes after each day’s opening bell, we get the data we need to put together a trade with the potential for 50% gains in no more than two hours.
And this is just one of seven different strategies I use every day with my subscribers.
Later on today, I’m opening the trade room to new participants — an opportunity which doesn’t come around often.
To make sure you’re one of them, go here to watch my brand-new presentation now.
Speak to you then,

Mike Carr
Senior Technical Analyst