Last week’s sector performance was a mixed bag as investors try to determine where the winners will be amid a lower interest-rate environment…
The utilities (XLU) and energy sectors (XLE) rebounded in a huge way to crush the broader S&P 500’s slight 0.3% decline.
The tech sector was mostly flat after leading the pack for two straight weeks.
And six sectors couldn’t muster positive performance, but weren’t that far off the broader market’s pace.
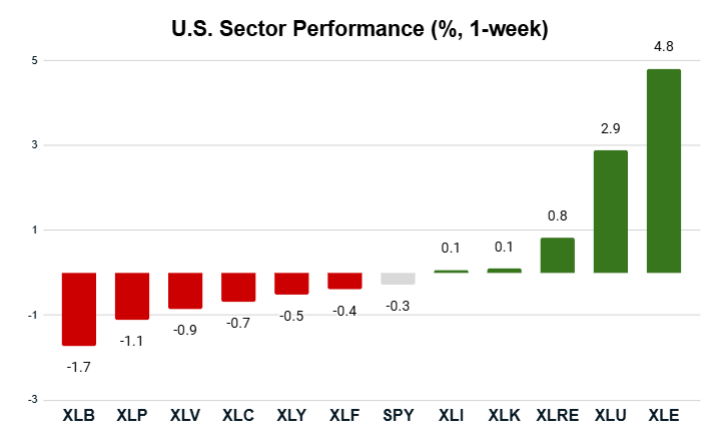
Here’s how it shook out:
Key Insights:
- The S&P 500 (SPY) closed with a slight 0.3% loss.
- Five sectors beat the S&P 500, while six lagged the index.
- The energy sector (XLE) charged 4.8% higher!
- The materials sector (XLB) was the worst performer with a 1.7% drop.
Let’s see how some of last week’s best and worst performers look within my Green Zone Power Rating system…
Behind the Energy Sector’s Strong Beat
If there’s one trend I’ve noticed since starting this analysis back in March, it’s that the energy sector (XLE) crushes the broader market in these weeks where it leads the pack.
That happened again with XLE’s 4.8% run higher, a full five percentage points better than the S&P 500.
Below, you’ll find nine energy stocks that closed last week within 10% of their 52-week highs and how they stack up in my Green Zone Power Rating system:
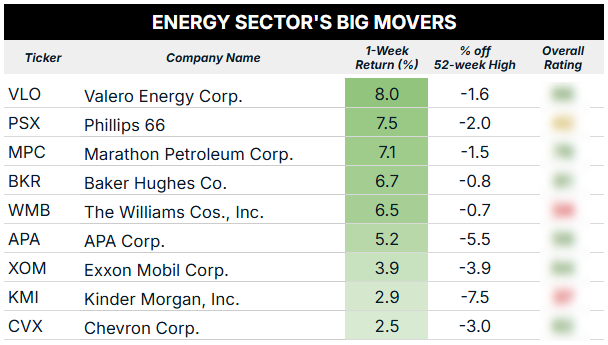
Once again, this list is chock-full of some of the biggest oil players. And I will note that six of these stocks currently rate “Bullish” or better in my system. That means they should continue outperforming by 2X to 3X over the coming months.
I’ve had a close eye on the energy sector for years now because I believe it holds some incredible opportunities to buy stocks at “dirt cheap” valuations, especially when compared to the tech sector (XLK). For reference, XLE currently trades at a trailing 12-month price-to-earnings ratio of 17.7 compared to XLK’s 40 P/E ratio…
The energy sector also offers higher yields, averaging 3.1% compared to the tech sector’s 0.6%.
It’s hard to argue against tech’s monster outperformance in this ongoing bull market — the sector is up more than 24% over the last year, crushing the energy sector’s 3% gain over the same time.
But my system is once again highlighting that the energy sector should not be ignored.
If you want to look any of these tickers up now to see how they rate, click here to learn how you can gain full access to my system with a Green Zone Fortunes membership. You’ll also see my handful of energy stock recommendations that have worked out very well for my subscribers over the years.
Now let’s move on to the worst performers…
Materials Led the Laggards
Of the six sectors that lagged the S&P 500 last week, the materials sector (XLB) was the worst performer by a fair margin, closing 1.7% lower.
Below, you’ll see the five XLB stocks that closed within 10% of their 52-week lows:
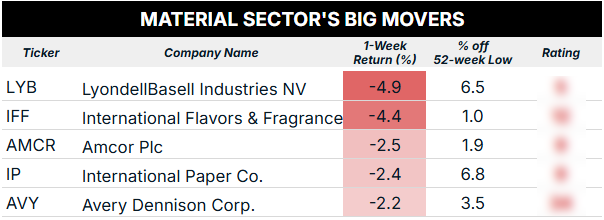
There’s a lot of red!
Not only did each of these stocks post losses last week, but they also all rate either “Bearish” or “High-Risk” in my Green Zone Power Rating system. Stocks in these categories are set to underperform the broader market over the next year.
I’m going to pick on LyondellBasell Industries (LYB) a bit to show you why the plastic resin and chemicals producer is one to avoid right now.
Get this … LYB doesn’t rate “Bullish” on any of my six individual factors!
LYB most certainly does not have positive price momentum right now. The stock is down more than 48% over the last year, pointing to why it rates a 4 out of 100 on my Momentum factor.
If you’re looking for a new materials stock to buy, LYB isn’t it. And based on the poor ratings above, you can go ahead and knock those other four stocks off your shortlist as well.
To good profits,

Editor, What My System Says Today