In just a few hours, it’s all but guaranteed that the Federal Reserve will cut its benchmark interest rate by at least 25 basis points.
And that means one thing…
An epic rally in small-cap stocks is about to be unleashed.
It’s been a tough ride for this market segment over the last few years. But as I’ll show you below, there are definitive signs of a sea change underway.
Moments like this are precisely why I include Size as one of six factors within the Green Zone Power Rating system. History shows that over time, smaller stocks outperform their larger peers, and we can use the Size factor to more easily find those opportunities.
Let’s have a closer look at what’s going on, why now … and just how high small caps could go.
It’s Been a Long Time Coming!
Small-cap investors have had a really tough go for quite a while now.
Here’s a chart that plots the price of the small-cap Russell 2000 index (IWM) versus the average of three large-cap indexes — the S&P 500 (SPY), Nasdaq 100 (QQQ) and Dow Jones Industrial Average (DIA).
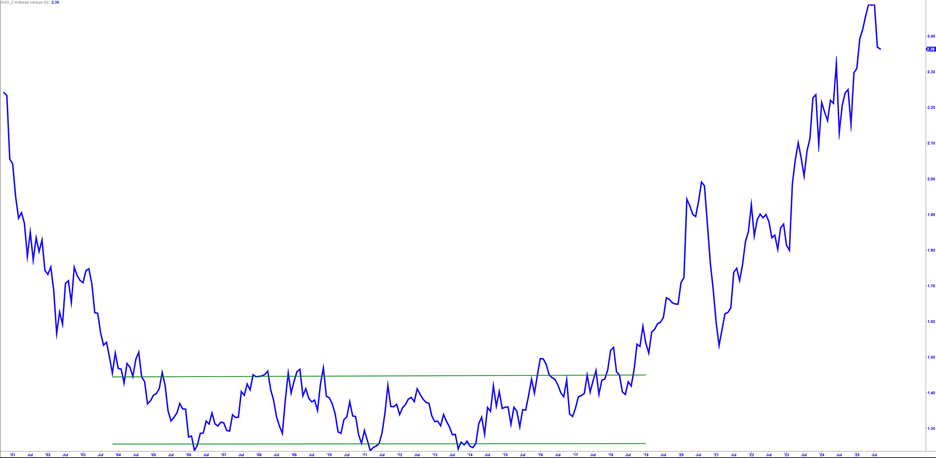
When small caps are outperforming, the ratio line declines. This was the case from 2000 into the early 2006 top of the U.S. property bubble.
Following that period, small-cap and large-cap stocks were equally matched, which can be seen in the ratio simply chopping sideways in a narrow range (the two green lines in the chart) between 2006 and 2018.
Next, the ratio line made a bullish breakout in late 2018 … marking the beginning of a multi-year run when large-cap stocks absolutely trounced small caps.
Here’s another look at the data from that period, beginning on August 1, 2018:
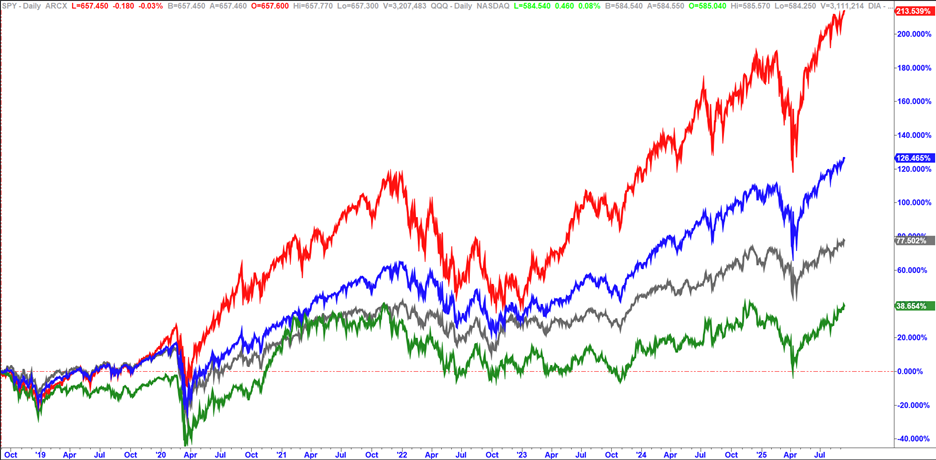
While the small-cap Russell 2000 (IWM, green) has gained a mere 39% over the past seven years (!)…
Large caps have gained between twice that (DIA, grey, +78%) and 5.5 times more than the Nasdaq (QQQ, red, +214%).
Yet another way to visualize this gaping discrepancy is a simple comparison of the price charts of IWM (small caps) and QQQ (tech-heavy large caps).
Here’s the chart of QQQ, with the dotted vertical line marking the same August 1, 2018, beginning of the time period:
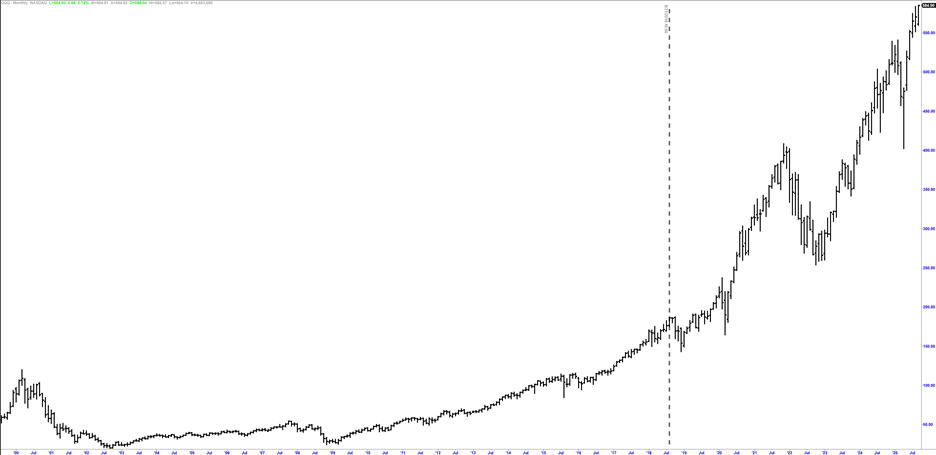
In simple terms, QQQ went “up and to the right,” quite strongly.
On the other hand, the chart of IWM is choppy as hell:
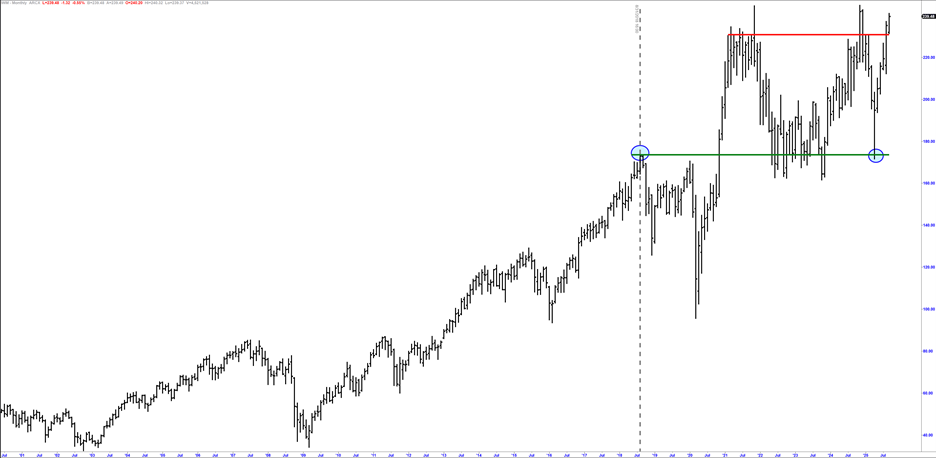
Take note of the two blue circles…
This shows that at the depth of the April tariff-scare lows, IWM was trading at the exact same price level it had been at in August 2018 — meaning, it was up 0% in five and a half years!
In comparison, QQQ only fell to its early-2022 highs during the April tariff scare and was still up more than 100% from its August 2018 levels.
So, What’s Ahead?
We can’t make money looking backward, so let’s talk through what may be ahead for small caps…
Currently, it appears we’re in the earliest stage of a bullish breakout in small caps.
For one, IWM’s monthly chart shows that it has already cleared the red line I drew. This line represents the bulk of the volume traded in the $220 to $230 range, which thwarted IWM’s advances twice before — in 2021 and again late last year.
Secondly, we’ve now seen small caps outperform large caps for around six weeks now…
Since August 1, small caps (IWM) are up 10.8% versus returns of between 6.7% (QQQ) and 5.2% (DIA) from the large-cap indexes.
Here’s the ratio chart that shows this turning point from another perspective:
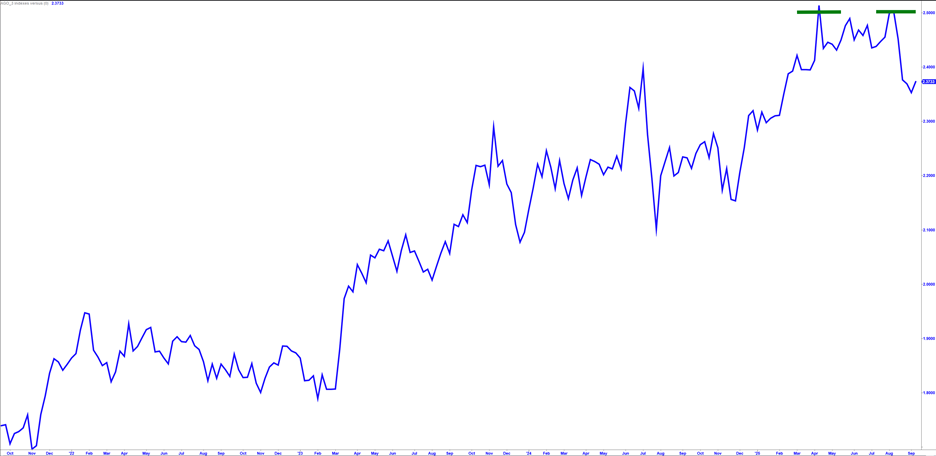
The relative strength of large caps made a “double top” pattern between April and July, followed by a steady decline over the last six weeks.
Is the timing of this turn notable? It is!
August 1 was also when the market began pricing in a likely Federal Reserve rate cut at this week’s meeting…
On July 31, the market was giving 60% odds of no cut … odds that rapidly declined to zero by mid-August — leaving only the debate over whether the cut will be 25 basis points or 50.
All told, it’s becoming more obvious that a “perfect storm” is brewing in small-cap land.
Small caps have taken a backseat to large caps for an incredibly long time, only able to build up “potential energy” within their tight trading range between 2018 and today.
All things are cyclical, so an expectation for large caps to always outperform, just because they have been, isn’t supported by history.
And once the pent-up demand for high-quality, fast-growing small-cap stocks is unleashed … once the “potential energy” in the space begins converting to “kinetic energy” … well, we can expect small-cap prices to move up strongly and fast.
Every bull market is different, but using the last one as a guide, we can see shares of IWM rallied from around $40 in 2009 to $175 in 2018 — a gain of $135 a share, or about 330% over nine years.
I’m expecting a reasonably similar small-cap bull market ahead … several hundred percent in returns over several years.
Tomorrow, we’ll review the latest batch of small-cap stocks to pass my “New Bulls” screen using my Green Zone Power Rating system.
To make sure you’ve got everything you need to find out exactly how these stocks stack up in my system, join me in Green Zone Fortunes for unlimited access to my system. Click here to see how you can do that now.
Maybe you’ll find the perfect ticker to ride this bullish momentum higher.
To good profits,
Editor, What My System Says Today