
I’ve got some good news and some bad news for you.
I’ll start with the good news: The United States is not the most expensive market in the world. That distinction belongs to Denmark, of all places.
So, if you’re a value investor, you might want to steer clear of those bubbly Danish stocks. They’re trading at a cyclically-adjusted price-to-earnings ratio (“CAPE”) of 43.
Now for the bad news…
U.S. stocks aren’t much cheaper than those crazy Danish stocks, trading at a CAPE of 38.
U.S. Stocks Are Expensive
And it’s not just the CAPE. Looking at the price-to-sales ratio, another common market valuation metric, the S&P 500 is nearly 50% more expensive than it was in the frothy last days of the 1990s internet bubble. At current prices, the S&P 500 trades at 3.1 times sales.
Valuation isn’t everything, of course. Expensive stocks get more expensive all the time, and cheap stocks get cheaper.
But all else equal, it pays to buy cheaper stocks. Value is one of the six factors we track in our Green Zone Ratings system, and we think it’s powerful, particularly when combined with other factors such as growth or momentum.
Value Stocks Are Overseas
Just for grins, let’s take a quick trip around the world to see what’s cheap … and what’s not. The following table ranks the countries of the world by a composite of four value metrics: the CAPE, the cyclically-adjusted price-to-dividend ratio (“CAPD”), the cyclically adjusted price-to-cash flow ratio (“CAPCF”) and the cyclically-adjusted price-to-book value ratio (“CAPB”).
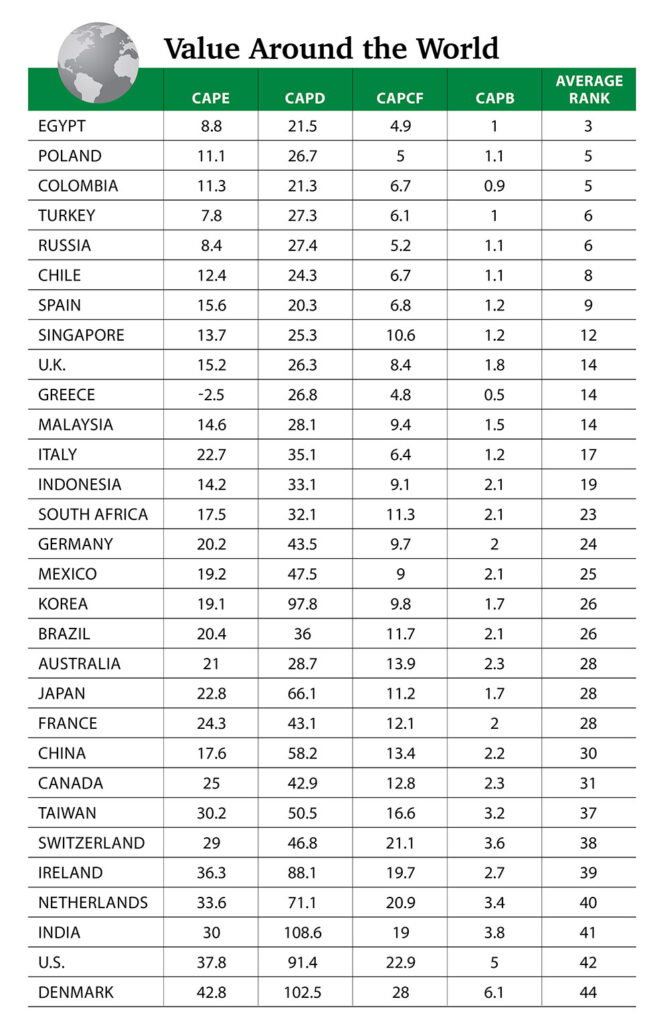
A couple of things jump right off the page.
Most of the cheapest countries are emerging markets. And they hail from the far-flung corners of the globe. Egypt is the cheapest country, but Poland, Colombia, the Czech Republic and Turkey aren’t far behind.
These countries have little in common other than the fact that they’re emerging markets. Their economies are vastly different. And they’re not even close to one another on the map.
There are exceptions, of course. India is one of the most expensive markets in the world, for example. But by and large, there is a clear difference based on development. The average CAPE of all developed markets (excluding the U.S.) is 24, whereas it’s 15 for emerging markets.
Now, I’m not going to suggest you run out and dump your entire IRA into Egyptian stocks. That would be madness. I couldn’t name a single Egyptian stock off the top of my head if my life depended on it.
But it makes sense to include a little exposure to emerging markets overseas. The iShares MSCI Emerging Markets ETF (NYSE: EEM), a common proxy for the emerging market space as a whole, shot up by more than 300% from its inception in May 2003 to its top in late 2007. That’s what a bull market in developing-world stocks looks like.
And with American stocks looking fully valued these days … doesn’t a little exposure overseas just make sense?
To safe profits,

Charles Sizemore
Editor, Green Zone Fortunes
Charles Sizemore is the editor of Green Zone Fortunes and specializes in income and retirement topics. Charles is a regular on The Bull & The Bear podcast. He is also a frequent guest on CNBC, Bloomberg and Fox Business.