I expect major market averages to fall. But that’s a short-term opinion. I outlined some of my reasons for that last week. Momentum, seasonals and pattern analysis all point to a top.
However, that doesn’t mean another bear market is lurking.
Remember that markets don’t just move straight up. Even the strongest uptrends are interrupted by pullbacks. Traders have known this for more than 120 years.
Charles Dow founded The Wall Street Journal in 1889. He served as its editor until his death in 1902. In that role, he often wrote daily market commentary.
One of Dow’s enduring observations was that traders should expect pullbacks. On January 30, 1901, he wrote:
If the market pursues its ordinary course, it will decline during the next two or three weeks to a point where the average of twenty stocks will be below 90. Whoever will study our averages, as given daily in the Journal for years past, will see how uniformly periods of advance have been followed by periods of decline, amounting in a large proportion of cases to from one-third to one-half of the rise.
Dow was referencing his Railroad Average, an index of railroad stocks he created in 1884. The index had rallied more than 30% in the first weeks of 1901. After falling about 4%, Dow knew traders were nervous. He reminded them to expect an 8% to 12% decline based on the previous advance.
Not much has changed in 122 years. Traders today still get nervous about every decline, no matter how small it is. What they often don’t realize is that they should be happy that the market just handed them an opportunity…
Don’t Worry, Be Happy
Truth is, long-term investors should welcome pullbacks. It’s their chance to buy the dip. Short-term traders should also welcome pullbacks. The dips often precede strong rallies.
Despite the benefits of pullbacks, they are widely feared. Maybe because they are misunderstood. Let’s look at the recent price action to explore this phenomenon.
Pullbacks retrace part of the previous advance. Retracement levels are added to charts to show where the pullback should stop.
In the chart of the SPDR S&P 500 ETF Trust (NYSE: SPY) below, retracement levels are shown as blue or purple lines. Blue lines are drawn at half of the previous advance. Purple lines mark one-third of retracements. And green lines define the advances.
Understanding Retracements Levels
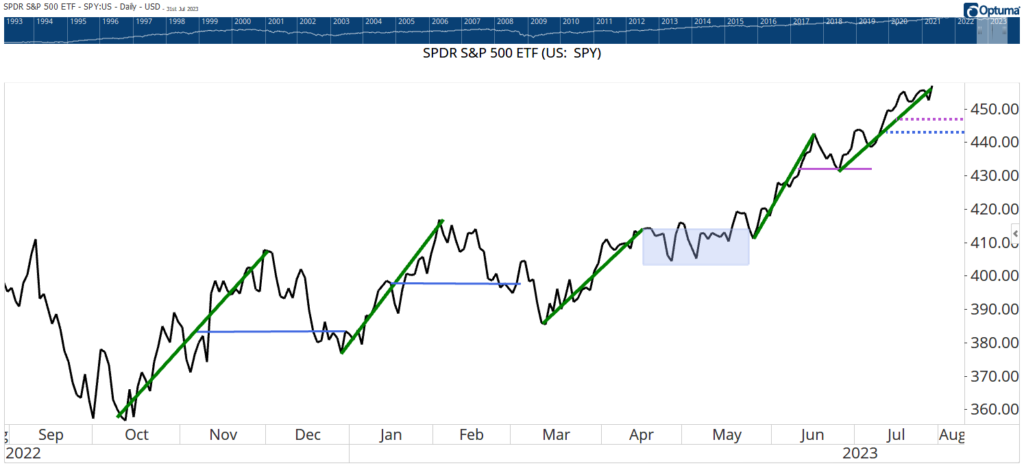
Two of the four completed retracements in the last year stopped at the blue line. In each case, the S&P 500 Index lost 50% of its most recent rally before reversing and climbing higher again. June’s pullback retraced one-third of the previous advance.
On the other occasion, from April to June, prices moved sideways. That’s highlighted with a blue rectangle. We call this a consolidation or a sideways trend. Dow called this pattern a line and explained that a line can replace a pullback.
Pullbacks Give Prices a “Rest”
Pullbacks figuratively give prices a brief rest after a rally. It allows time to correct any excesses of the rally. It can also take the form of a line — or consolidation where prices move sideways. They both serve the same function of giving prices a “rest.”
That brings us to the current price action, which has been strong with prices racing higher. As Dow explained: “…Periods of advance have been followed by periods of decline.” A one-third retracement is just 2% below the current level. A one-half retracement is about 4% lower.
The coming pullback is expected and normal. It’s not a reason to panic. It’s a chance to prepare for the next up move in stocks.
And that’s what I’m doing every day in my Trade Room. I, alongside my colleague Matt Clark and hundreds of people in my trading community, kick off each day at the opening bell.
Over the first open trading hour or so, we find the best opportunities that day’s market is presenting us using various strategies I’ve developed (one of which I call the “9:46 Rule”), and then walk through the trades with the highest potential for success.
While other investors fear a pullback, I’ll be in the trade room finding opportunities for profit — no matter what the market does next.
If that sounds like something for you, click here to see how you can gain access now.
Until next time,

Mike Carr
Senior Technical Analyst